Quake probabilities for the San Francisco Bay region are derived by balancing
two processes—(1) the motions of the plates that make up the Earth’s
outer shell and (2) the slip on faults, which occurs primarily during earthquakes.
The continual northwestward motion of the Pacific Plate past the North American
Plate loads strain onto the network of active faults that slice through the
region. Earthquakes sporadically release and redistribute this strain.
One side of the balance is the rate at which plate motions load strain onto
faults. Development of the Global Positioning System (GPS) has allowed geophysicists
to make accurate measurements of how the current plate motions—totaling
1.6 inches per year across the entire Bay region—distribute strain onto
individual faults. Geologic studies also contribute to this understanding by
documenting long-term fault slip, which must match the strain-loading rate.
For example, on the San Gregorio Fault near Moss Beach, a buried stream channel
has been offset about 1,000 feet over the past 80,000 years, giving a local
slip rate of about one-sixth of an inch per year.
On the other side of the balance is slip on faults, primarily during earthquakes.
Data from seismograms, historical accounts, and trenches that reveal buried
fault ruptures provide information about past quakes in the San Francisco Bay
region. U.S. Geological Survey and other scientists reanalyzed seismograms and
historical accounts and excavated many new trenches across faults as part of
recent reassessments of earthquake hazards in the region. For example, a trench
in El Cerrito revealed evidence of four to seven large quakes on the Hayward
Fault during the past 2,200 years. Unfortunately, seismogram records only go
back to about 1900, historical accounts in this region are fragmentary before
1850, and trenches are effective only in some locations.
|
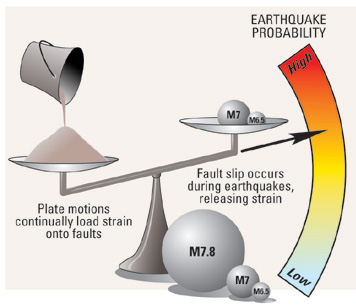
Quake probabilities are derived by balancing two processes—(1) the continual motions of the plates that make up the Earth’s outer shell (represented by pouring sand onto the left tray) and (2) the slip on faults, which occurs primarily during earthquakes (equivalent to adding balls to the right tray). The slip on faults over time must balance the strain built up by the plate motions. The total amount of slip during an earthquake, shown here by the proportional volumes of the spheres, depends on its magnitude (M). The larger the quake, the more strain released. Knowledge of past earthquakes is essential for estimating the odds of future temblors. This knowledge comes from historical damage accounts, fault ruptures exposed in trenches, and seismographic records. |
Supplementing these data with up-to-date knowledge about how faults work, scientists are able to make better projections of the expected sizes and locations of future quakes. If Earth scientists can identify the lengths of fault segments that may rupture in an earthquake, they can estimate the magnitudes and amounts of slip for possible future quakes.
For example, the magnitude 7.8 San Francisco earthquake of 1906 ruptured 300
miles of the San Andreas Fault and produced as much as 25 feet of slip, whereas
the magnitude 6.9 Loma Prieta quake in 1989 ruptured only 25 miles of fault
and produced only about 6 feet of slip. Scientists identify fault segments by
studying bends, intersections, and gaps in faults, past earthquake ruptures,
and major changes in rock types along faults.
Over millennia the balance between plate motions and slip on faults must even out, and therefore average long-term earthquake probabilities can be reliably calculated. However, calculating accurate odds for a short time period such as 30 years is more difficult, and alternative models lead to different results. For example, the rate of large quakes in the Bay region was high in the late 1800’s but dropped abruptly after the 1906 San Francisco earthquake. Scientists believe that this rate dropped because the San Andreas Fault slipped so much over such a great length in—1906 that the strain was reduced on most faults throughout the region. Because plate motions are continuous, strain has been slowly building up again, and strong earthquakes began to reoccur in the 1980’s. However, the level of seismic activity in the Bay region has not yet reached that of the late 1800’s. Some earthquake models forecast that this relatively low level of activity should continue for some time and that earthquake probabilities therefore will be lower than average. Other models, in which earthquakes on different faults recur on somewhat regular schedules, yield higher than average probabilities for the next few decades.
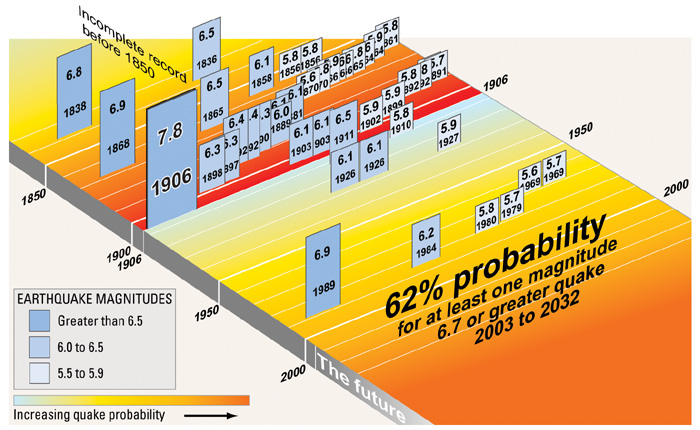 |
| The rate of large earthquakes in the San Francisco Bay region dropped abruptly after the Great 1906 Earthquake. The San Andreas Fault slipped so much over such a great length in that quake that the strain was reduced on most faults throughout the region. Strain has been slowly building up again. However, the level of seismic activity has not yet reached that of the late 1800’s. |
At some point, the rate of earthquakes in the Bay region must increase so that the balance will once again even out. Earth scientists do not agree on how soon this may happen, because they do not yet sufficiently understand the process by which strain reductions are imposed by large earthquakes and are removed by plate motions and the slow deformation of the Earth. We know what is on the two sides of the balance, but do not know all the details of how the balance really works.
Given the uncertainty in how to model future earthquake behavior, determining
earthquake probabilities involves making many decisions, such as defining fault
segments and choosing among alternative statistical models. Because such decisions
are uncertain, recent reassessments of Bay region earthquake probabilities have
assigned weights to the various choices so that all were included in the overall
calculations. These weights led to an average result of 62%, but this value
could be as low as 37% or as high as 87%, given the uncertainties in these choices.
Regardless, the San Francisco Bay region has substantial earthquake hazard.