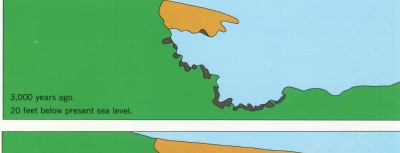
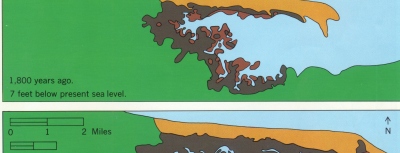
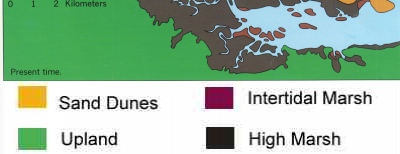
Figure 25

Stages in the development of Sandy Neck spit and the Great Marshes west of Barnstable from 3,000 years ago to present time. The marsh grew upward in response to the rising sea and laterally in response to the growth of the spit. The maps, ages, and relative sea level .

Figure 25. Stages in the development of Sandy Neck spit and the Great Marshes west of Barnstable --this image shows 3,000 years ago, 20 feet below present sea level.
Figure 25. Stages in the development of Sandy Neck spit and the Great Marshes west of Barnstable--this image shows 1800 years ago, 7 feet below present sea level.
Figure 25. Stages in the development of Sandy Neck spit and the Great Marshes west of Barnstable from -- this image shows present time.