|
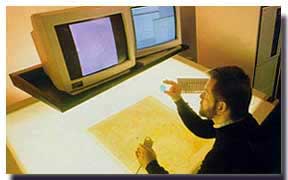
Answer true, or false: To draw a map of an area, you have to visit it first. If you are John Wesley Powell mapping the route of the Colorado River through the Grand Canyon in 1869, the correct answer is "true." You will need to convince a group of nine others to risk their lives with you on the first trip ever taken, through the canyon. You won't know how far you're going, how long your trip will be, or what dangers lie around the next curve of the river. Today, however, thanks to computers and airplane and satellite photography, the correct answer is "false." To make a map of an area, you never need to leave your office. The tens of thousands of maps that the U.S. Geological Survey (USGS) produces are made on computers by teams of specialists in the earth sciences, such as cartographers and geographers, and computer experts who often have no formal training in the natural sciences. |
Get a Bird's-Eye View of Your BackyardIn June 1998, the USGS 'and Microsoft opened the "world's largest online database," callled TerraServer. You can find an aerial photograph of almost any spot in the United States and zoom in on it until you can see individual houses. You can reach TerraServer at www.terraserver.microsoft.com |
|
Because of computerization, maps can be devised to give enormous amounts of precise and specialized information. Collections of computer hardware and software known as geographic information systems (GIS) can be used to produce complex maps that combine layers of data. Uses of GIS's range from protecting wetlands from pollution to forecasting a city's evacuation time in an emergency. Say there's a pond at the end of the street where you live. If you want to build a boat dock on the pond, you might want to know how big the pond becomes when it fills with rain in the spring and how small it becomes during summer dry spells. GIS experts can get this information for you by combining topographic and other maps with data that were collected during the past 35 years and were digitized to be usable in computers. The data come from photographs taken from airplanes and from other kinds of remote sensing, not from people going to the pond and measuring it. |
Powell's trip, made when the only way to map a place was to go there, was known as a survey. Today the USGS produces its popular topographic maps by using remote photography and computers. |
Topographic maps are the most widely used maps the USGS produces and some of the first maps the agency produced more than 100 years ago when people like Powell had to visit an area to map it. Topographic maps show the shape and elevation of the terrain along with natural features like rivers and lakes. They put a three-dimensional picture on a two-dimensional surface. Engineers use topographic maps to plan highways and dams. Architects use them to design buildings that will complement a chosen site. Hikers and campers use them to plan their outings. Ecologists use them to protect fragile areas.
Most of the topographic maps that the USGS produces are on a scale of 1:24,000, which means that an inch on the map represents 2,000 feet — or slightly more than one-third of a mile — on the ground. Each map covers 7.5 minutes of latitude and of longitude and covers 50 to 55 square miles. These maps are called 7.5-minute quadrangle maps. In order to be used in GIS's, existing topographic maps were scanned so computers could interpret the information. It used to take 4 to 5 years to produce a topographic map. Computers shorten that time enormously.
|
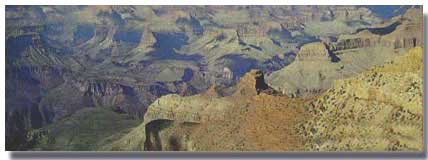
The photographs and drawings from John Wesley Powell's trip to the Grand Canyon were the first images of the Canyon's spectacular layers of rock, like the ones shown here. Powell's geologic maps helped the settlement of the American West and are still referred to today. |
Maps and computers played an important part in a recent attempt to restore the appearance of the Colorado River through the Grand Canyon to something that John Wesley Powell might have recognized. Until the Glen Canyon Dam was built in 1963, the Colorado River periodically flooded. When it flooded, the river deposited tons of sand that maintained the beaches along its banks. Once the dam stopped the river from flooding, the beaches began to disappear from the lack of new deposits of sand. Hydrologists thought that a large release of water could help restore the beaches. Before they released the water, however, they made computer models to map the sand and water flow down the river. The torrents of water released down the river restored the stream banks almost exactly as the models had predicted. Success!
|| Back to the top || Back to Scientists in Action Front Page ||
[an error occurred while processing this directive]
[an error occurred while processing this directive]