|
The U-2, a plane that used to fly reconnaissance missions over the former Soviet Union, has been modified by NASA to gather data to help forecast brush fires and spot toxic wastes. Renamed the ER-2, the plane is equipped with an imaging spectrometer, an instrument that measures the wavelengths, or spectrum, of light that a material absorbs or reflects. Every material from gold to tree bark absorbs or reflects light differently, so it has a unique spectral signature — just as every human being has a unique fingerprint. "Your eye is a crude spectrometer," explains Roger Clark, a scientist at the U.S. Geological Survey (USGS) Spectroscopy Lab. "The colors that our eyes sense are due to the absorption bands in materials." For example, a leaf looks green because it contains chlorophyll, which absorbs a particular band of light that we see as green. Our eyes, however, cannot see all wavelengths of light. The imaging spectrometer expands the capability of our eyes. The measurements made by the spectrometer can be used to locate any natural or manmade material, ranging from minerals at old mine sites to microorganisms in hot springs to moisture in plants. The data are then used to produce maps like the one on this page. Each color on the map represents a specific mineral. These minerals came from waste materials that were left behind from mining operations in the area around Leadville, Colo. Some of the waste materials are rich in minerals that can be a source of contamination to rivers and streams. Because the map pinpoints the exact location of the minerals that can cause problems, cleanup efforts can be carried out more efficiently and cost effectively. This new mapping technique is also helping scientists to forecast brush fires in the Santa Monica Mountains. Fires that start in these mountains can spread to nearby communities. "In the case of the Santa Monica Mountains, we are measuring the presence of molecules such as chlorophyll, leaf water, and cellulose. By measuring these molecules, we can map different vegetation patterns, all of which play a role in predicting wildfire hazards," says Robert Green, a scientists at NASA's Jet Propulsion Laboratory (JPL) where the airborne spectrometer was developed. The computer software used to analyze the data and produce maps was created by Roger Clark at the USGS. An imaging spectrometer is also helping to map our solar system. Clark, who is a planetary scientist and an expert in mineral and vegetation mapping, is a team member on several spacecraft missions. The spacecrafts orbiting Mars and the satellites of Jupiter as well as the space probe on its way to Saturn are each equipped with an imaging spectrometer. You can find out more about the USGS Spectroscopy Lab and see examples of the maps they produce at the Web site usgsprobe.cr.usgs.gov/xray.html. More information about how the imaging spectrometer works can be found at the NASA Web site, www.jpl.nasa.gov/. |
This ER-2 airplane is equipped with an imaging spectrometer that can take some 7,000 measurements per second while flying 20 kilometers (12 miles) above sea level and at a speed of 730 kilometers per hour (450 miles per hour).
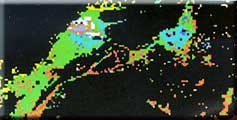
Mineral Map of waste rock from mining operations near Leadville, Colo. The map identifies those minerals that can contribute to water contamination. Blue, purple, and yellow colors show minerals that are of most concern. Areas in green are of less concern. Other colors represent minerals that do not contribute to water contamination. |
|| Back to the top || Back to Scientists in Action Front Page ||
[an error occurred while processing this directive]
[an error occurred while processing this directive]