GROUND WATER ATLAS of the UNITED STATES
Oklahoma, Texas
HA 730-E
Coastal lowlands aquifer system
There are two different files for each illustration
- A 72 ppi GIF file, suitable for screen viewing is accessed through
the thumbnail image
- An eps file, suitable for downloading to be printed or edited is accessed
through the "eps file" link. Most files are Adobe Illustrator
6.0, exceptions are noted. These files have been compressed with GNU's
gzip utility. If your web browser defaults to a screen display of the file,
turn on the "Load to local disk" option before downloading. Download
and process these eps files as ascii, not binary.
Ground-water development
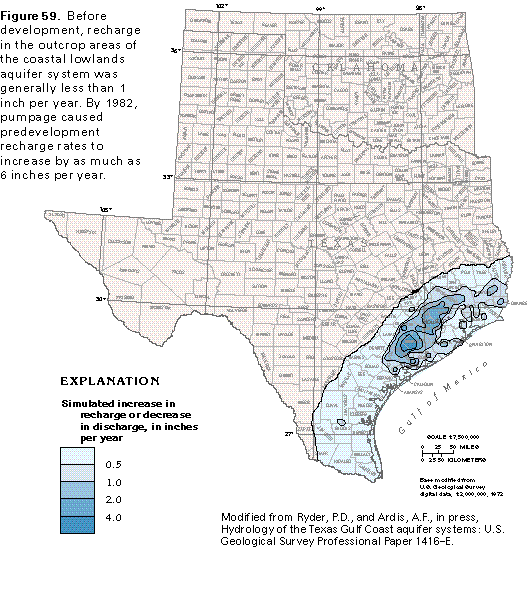
Figure 59 Map showing simulated increase in recharge or decrease
in discharge (50K)
 editable eps file E059.eps.gz
(149K compressed)
editable eps file E059.eps.gz
(149K compressed)
Figure 60 Map showing potentiometric contour of permeable
zone B (33K)
 editable eps file E060.eps.gz
(132K compressed)
editable eps file E060.eps.gz
(132K compressed)
Figure 61 Map showing potentiometric contour of permeable
zone C (17K)
 editable eps file E061.eps.gz
(66K compressed)
editable eps file E061.eps.gz
(66K compressed)
Figure 62 Map showing net potentiometric-surface decline
of permeable zone B (33K)
 editable eps file E062.eps.gz
(66K compressed)
editable eps file E062.eps.gz
(66K compressed)
Figure 63 Map showing net potentiometric-surface decline
of permeable zone C (17K)
 editable eps file E063.eps.gz
(66K compressed)
editable eps file E063.eps.gz
(66K compressed)
Figure 64 Map showing approximate land-surface subsidence
(33K)
 editable eps file E064.eps.gz
(50K compressed)
editable eps file E064.eps.gz
(50K compressed)
Figure 65 Photo showing effects of land surface subsidence
in Baytown, Texas (33K)
 This illustration contains a placed image. Download the Adobe Illustrator
6 eps file E065.eps.gz (4.3M compressed)
which contains an imbedded Adobe Photoshop 3 (eps) file. You may also want
to download the editable Photoshop
file E065psh.eps.gz (4.2M compressed)
This illustration contains a placed image. Download the Adobe Illustrator
6 eps file E065.eps.gz (4.3M compressed)
which contains an imbedded Adobe Photoshop 3 (eps) file. You may also want
to download the editable Photoshop
file E065psh.eps.gz (4.2M compressed)
 editable eps file E059.eps.gz
(149K compressed)
editable eps file E059.eps.gz
(149K compressed) 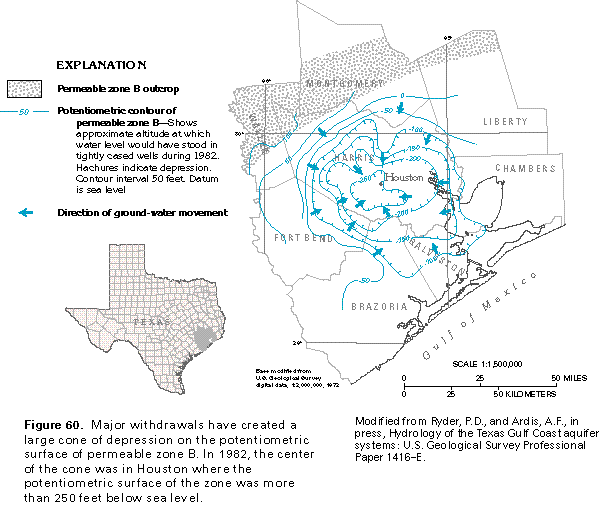 editable eps file E060.eps.gz
(132K compressed)
editable eps file E060.eps.gz
(132K compressed) 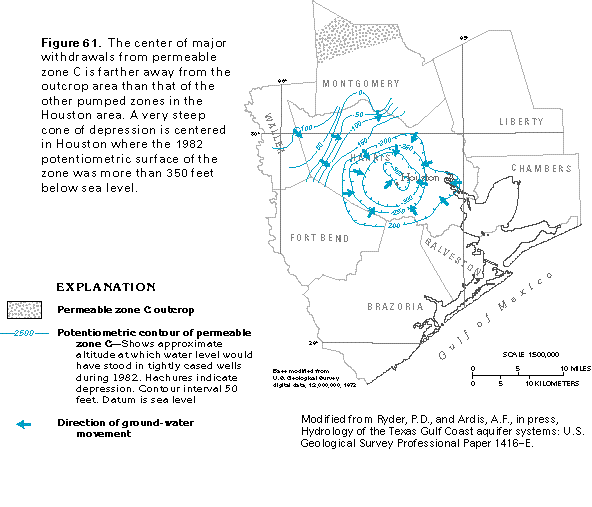 editable eps file E061.eps.gz
(66K compressed)
editable eps file E061.eps.gz
(66K compressed) 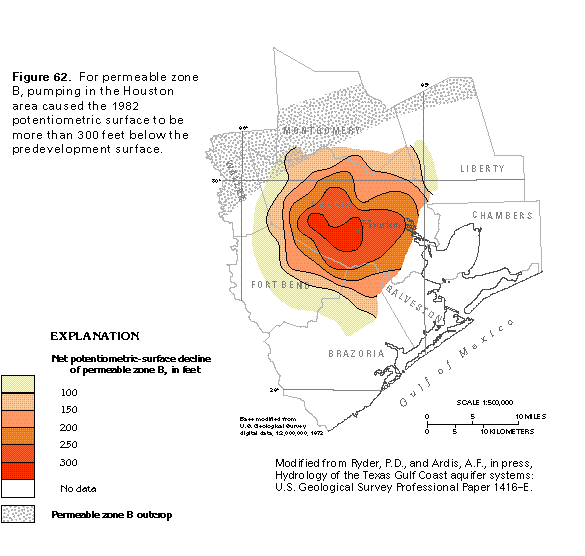 editable eps file E062.eps.gz
(66K compressed)
editable eps file E062.eps.gz
(66K compressed) 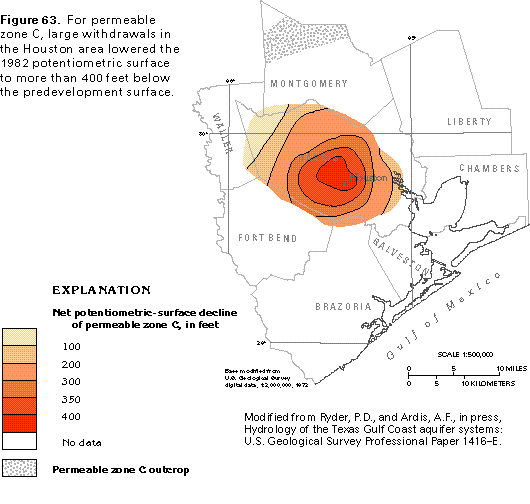 editable eps file E063.eps.gz
(66K compressed)
editable eps file E063.eps.gz
(66K compressed) 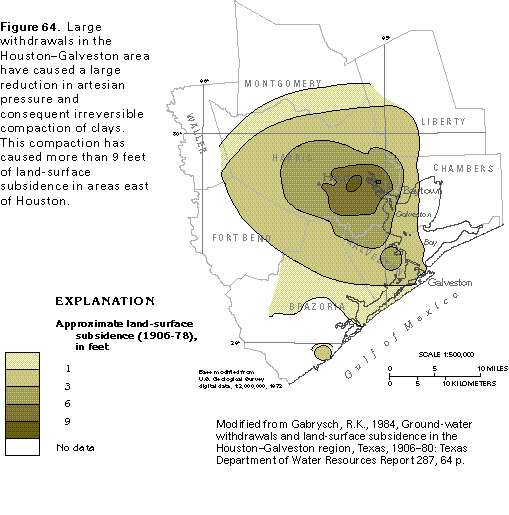 editable eps file E064.eps.gz
(50K compressed)
editable eps file E064.eps.gz
(50K compressed) 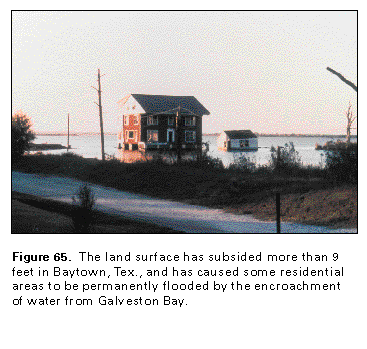 This illustration contains a placed image. Download the Adobe Illustrator
6 eps file E065.eps.gz (4.3M compressed)
which contains an imbedded Adobe Photoshop 3 (eps) file. You may also want
to download the editable Photoshop
file E065psh.eps.gz (4.2M compressed)
This illustration contains a placed image. Download the Adobe Illustrator
6 eps file E065.eps.gz (4.3M compressed)
which contains an imbedded Adobe Photoshop 3 (eps) file. You may also want
to download the editable Photoshop
file E065psh.eps.gz (4.2M compressed)