 downloadable tiff file G030.tif.gz (2.5MB
compressed)
downloadable tiff file G030.tif.gz (2.5MB
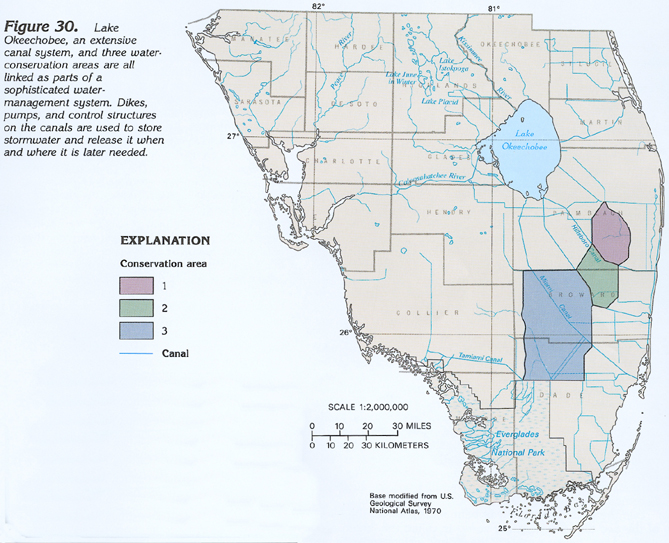
compressed) Figure 30 Map showing the canal system and water-conservation
areas in southern Florida (340K)
downloadable tiff file G030.tif.gz (2.5MB
compressed)
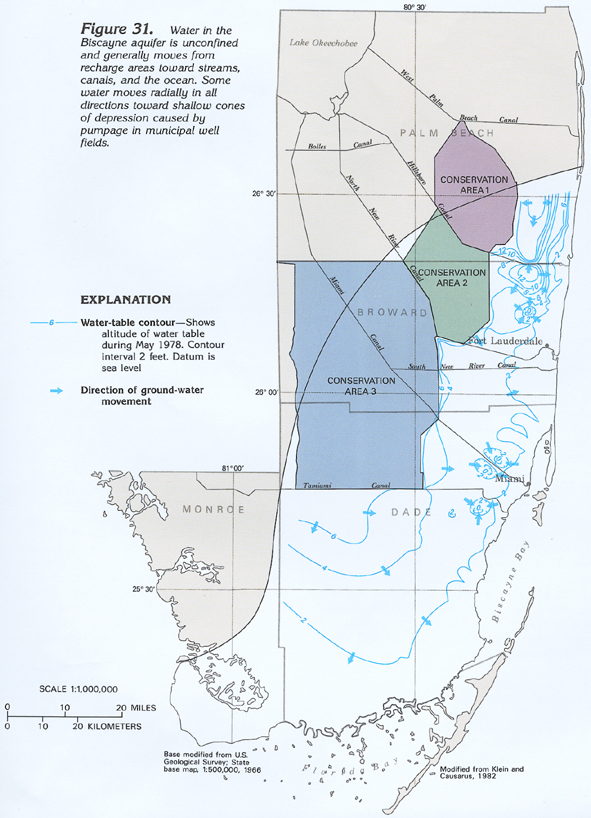
Figure 31 Map showing water-table contours and the water movement
in the Biscayne aquifer in southern Florida (388K)
 downloadable tiff file G031.tif.gz (3.2MB
compressed)
downloadable tiff file G031.tif.gz (3.2MB
compressed)
 downloadable tiff file G032.tif.gz (1.8MB
compressed)
downloadable tiff file G032.tif.gz (1.8MB
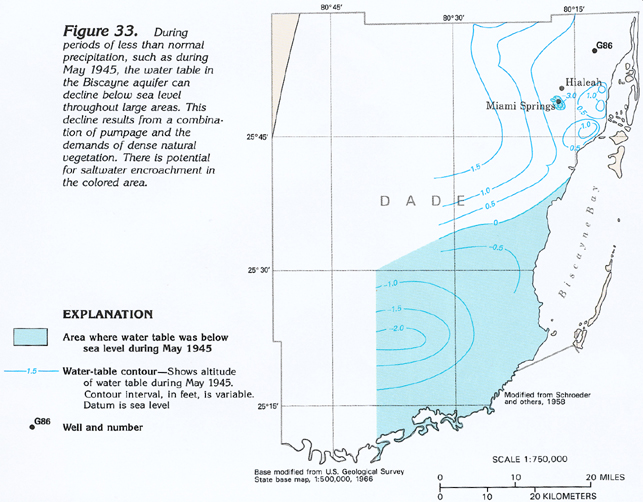
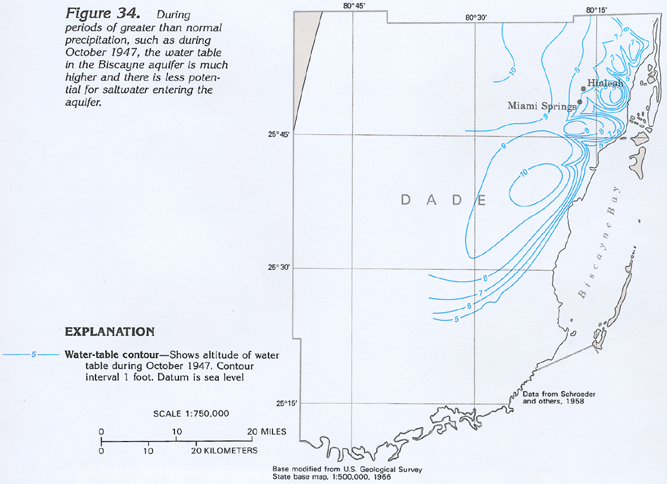
compressed) Figure 33 Map showing water-table contours and the general
direction of water movement in the Biscayne aquifer (240K)
 downloadable tiff file G033.tif.gz (1.6MB
compressed)
downloadable tiff file G033.tif.gz (1.6MB
compressed)
 downloadable tiff file G034.tif.gz (1.8MB
compressed)
downloadable tiff file G034.tif.gz (1.8MB
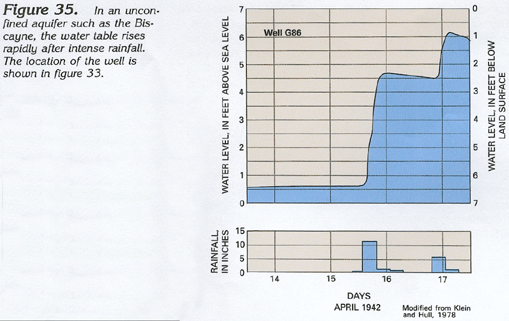
compressed) Figure 35 Graph showing the rise of the water level after intense
rainfall in well G-86 located in Miami, Florida (140K)
 downloadable tiff file G035.tif.gz (1.2MB
compressed)
downloadable tiff file G035.tif.gz (1.2MB
compressed)
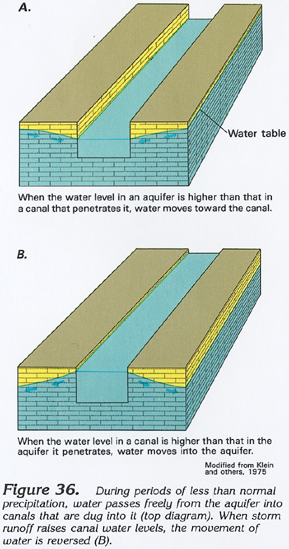
Figure 36 Diagram showing the hydraulic connection between
the Biscayne aquifer and the canals that cross it (172K)
 downloadable tiff file G036.tif.gz (1.4MB
compressed)
downloadable tiff file G036.tif.gz (1.4MB
compressed)
 downloadable tiff file G037.tif.gz (1.4MB
compressed)
downloadable tiff file G037.tif.gz (1.4MB
compressed)