GROUND WATER ATLAS of the UNITED STATES
Iowa, Michigan, Minnesota, Wisconsin
HA 730-J
Cambrian-Ordovician aquifer system
There are two different files for each illustration
- A 90 ppi JPEG file, suitable for screen viewing is accessed
through the thumbnail image
- A tiff file is accessed through the "tiff file"
link. All files are Adobe Photoshop. These files have been compressed
with GNU's gzip utility. If your web browser defaults to a screen
display of the file, turn on the "Load to local disk"
option before downloading. Download and process these tiff files
as ascii, not binary.
Hydrogeologic Units
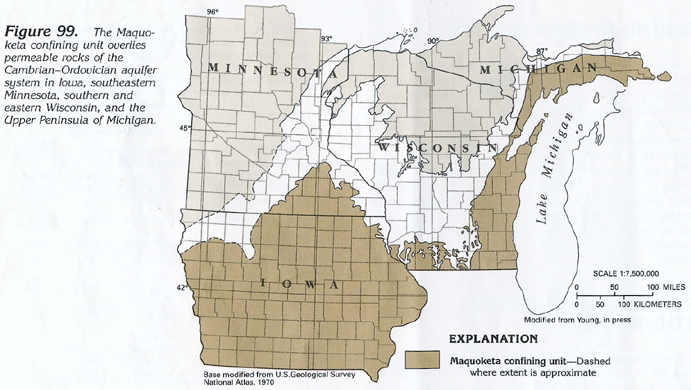
Maquoketa Confining Unit
Figure 99 Map showing location of Maquoketa confining
unit (242K)
 downloadable tiff file J099.tif.gz (2.4MB
compressed)
downloadable tiff file J099.tif.gz (2.4MB
compressed)
Figure 100 Correlation chart providing information about the Maquoketa
and St. Lawrence-Franconia confining units and the St. Peter-Prairie
du Chien-Jordan aquifer (301K)
 downloadable tiff file J100.tif.gz (2.8MB
compressed)
downloadable tiff file J100.tif.gz (2.8MB
compressed)
St. Peter-Prairie du Chien-Jordan Aquifer
Figure 101 Map showing location of the St. Peter-Prairie
du Chien-Jordan aquifer (245K)
 downloadable tiff file J101.tif.gz (2.1MB
compressed)
downloadable tiff file J101.tif.gz (2.1MB
compressed)
Figure 102 Map showing location of the St. Peter Sandstone
(261K)
 downloadable tiff file J102.tif.gz (2.4MB
compressed)
downloadable tiff file J102.tif.gz (2.4MB
compressed)
Figure 103 Photograph showing an example of St. Peter Sandstone
(273K)
 downloadable tiff file J103.tif.gz (2.3MB
compressed)
downloadable tiff file J103.tif.gz (2.3MB
compressed)
Figure 104 Map showing stratigraphic units
on which the St. Peter Sandstone was deposited (282K)
 downloadable tiff file J104.tif.gz (2.5MB
compressed)
downloadable tiff file J104.tif.gz (2.5MB
compressed)
Figure 105 Map showing thickness of the St. Peter Sandstone
(254K)
 downloadable tiff file J105.tif.gz (2.2MB
compressed)
downloadable tiff file J105.tif.gz (2.2MB
compressed)
Figure 106 Photograph showing dolomite from
the Prairie du Chien Group (228K)
 downloadable tiff file J106.tif.gz (1.7MB
compressed)
downloadable tiff file J106.tif.gz (1.7MB
compressed)
Figure 107 Map showing location if the Prairie du Chien
Group (257K)
 downloadable tiff file J107.tif.gz (1.9MB
compressed)
downloadable tiff file J107.tif.gz (1.9MB
compressed)
Figure 108 Map showing location of the Jordan
Sandstone (200K)
 downloadable tiff file J108.tif.gz (1.6MB
compressed)
downloadable tiff file J108.tif.gz (1.6MB
compressed)
Figure 109 Map showing thickness of the Jordan Sandstone (323K)
 downloadable tiff file J109.tif.gz (2.7MB
compressed)
downloadable tiff file J109.tif.gz (2.7MB
compressed)
St. Lawrence-Franconia Confining Unit
Figure 110 Correlation chart providing information about
the St. Lawrence-Franconia and Eau Claire confining units and
the Ironton-Galesville aquifer (149K)
 downloadable tiff file J110.tif.gz (1MB
compressed)
downloadable tiff file J110.tif.gz (1MB
compressed)
Ironton-Galesville Aquifer
Figure 111 Map showing location if the Ironton-Galesville
aquifer (294K)
 downloadable tiff file J111.tif.gz (2.6MB
compressed)
downloadable tiff file J111.tif.gz (2.6MB
compressed)
Figure 112 Generalized vertical section across the Hollandale
Embayment showing placement of the Ironton-Galesville aquifer
(226K)
 downloadable tiff file J112.tif.gz (1.8MB
compressed)
downloadable tiff file J112.tif.gz (1.8MB
compressed)
Eau Claire Confining Unit
Mount Simon Aquifer
Figure 113 Correlation chart providing information about
the Eau Claire confining unit and the Mount Simon and crystalline-rock
aquifers (177K)
 downloadable tiff file J113.tif.gz (1.2MB
compressed)
downloadable tiff file J113.tif.gz (1.2MB
compressed)
Figure 114 Map showing location if the Mount Simon Aquifer
(535K)
 downloadable tiff file J114.tif.gz (4.3MB
compressed)
downloadable tiff file J114.tif.gz (4.3MB
compressed)
Figure 115 Map showing thickness of the
Mount Simon Aquifer (292K)
 downloadable tiff file J115.tif.gz (2.6MB
compressed)
downloadable tiff file J115.tif.gz (2.6MB
compressed)
 downloadable tiff file J099.tif.gz (2.4MB
compressed)
downloadable tiff file J099.tif.gz (2.4MB
compressed) 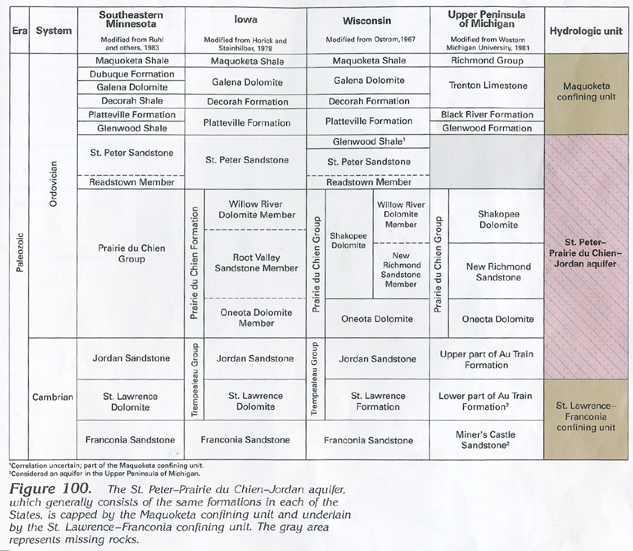 downloadable tiff file J100.tif.gz (2.8MB
compressed)
downloadable tiff file J100.tif.gz (2.8MB
compressed) 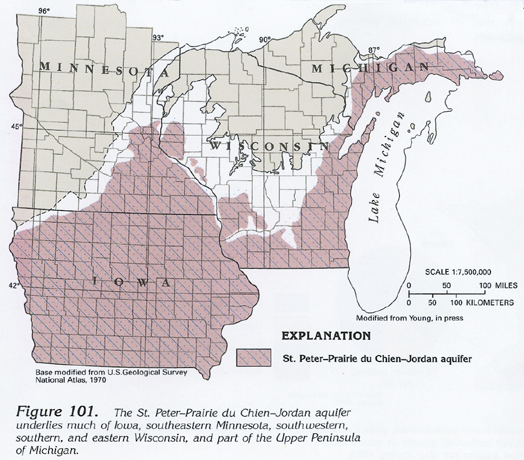 downloadable tiff file J101.tif.gz (2.1MB
compressed)
downloadable tiff file J101.tif.gz (2.1MB
compressed) 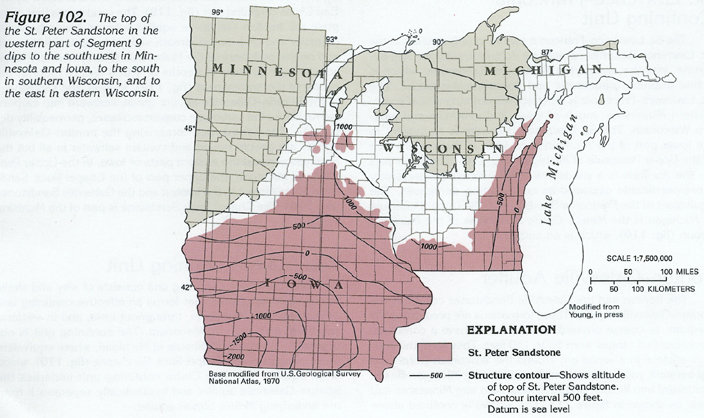 downloadable tiff file J102.tif.gz (2.4MB
compressed)
downloadable tiff file J102.tif.gz (2.4MB
compressed) 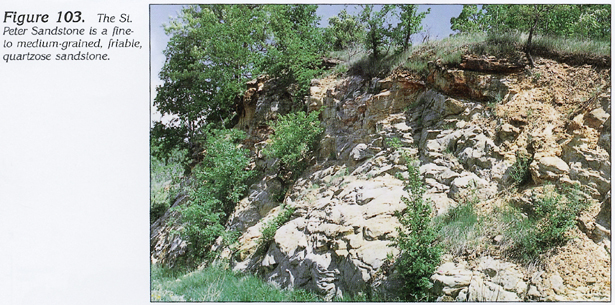 downloadable tiff file J103.tif.gz (2.3MB
compressed)
downloadable tiff file J103.tif.gz (2.3MB
compressed) 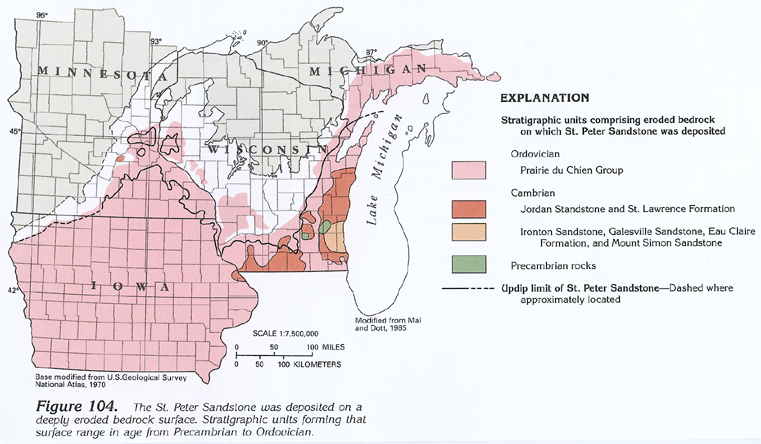 downloadable tiff file J104.tif.gz (2.5MB
compressed)
downloadable tiff file J104.tif.gz (2.5MB
compressed) 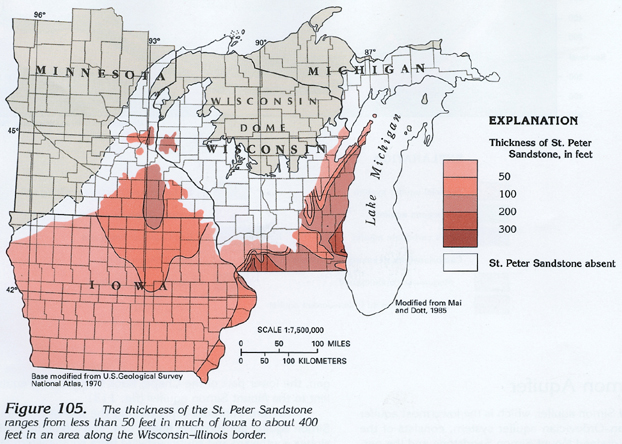 downloadable tiff file J105.tif.gz (2.2MB
compressed)
downloadable tiff file J105.tif.gz (2.2MB
compressed) 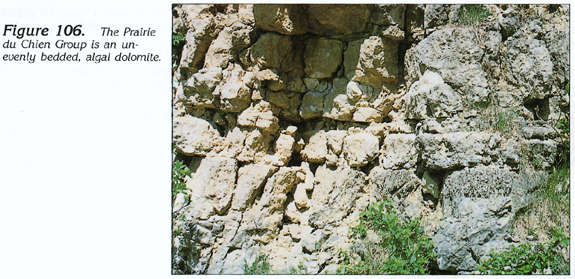 downloadable tiff file J106.tif.gz (1.7MB
compressed)
downloadable tiff file J106.tif.gz (1.7MB
compressed) 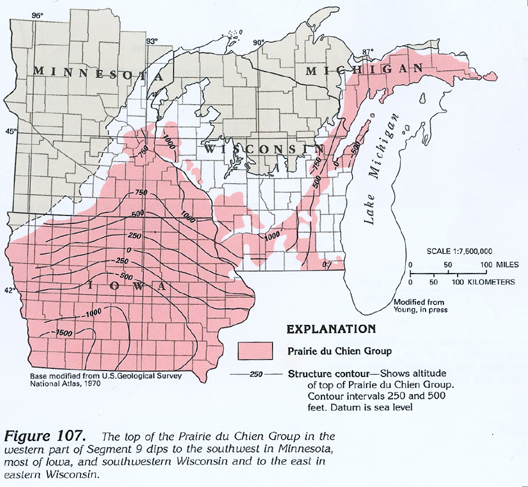 downloadable tiff file J107.tif.gz (1.9MB
compressed)
downloadable tiff file J107.tif.gz (1.9MB
compressed) 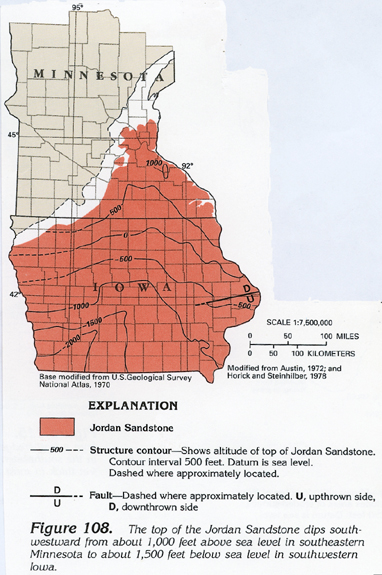 downloadable tiff file J108.tif.gz (1.6MB
compressed)
downloadable tiff file J108.tif.gz (1.6MB
compressed)  downloadable tiff file J109.tif.gz (2.7MB
compressed)
downloadable tiff file J109.tif.gz (2.7MB
compressed) 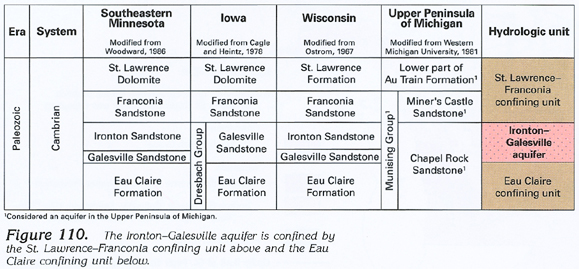 downloadable tiff file J110.tif.gz (1MB
compressed)
downloadable tiff file J110.tif.gz (1MB
compressed) 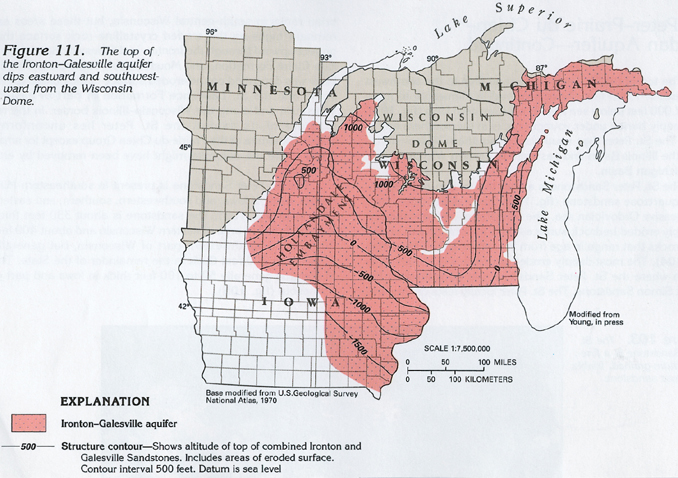 downloadable tiff file J111.tif.gz (2.6MB
compressed)
downloadable tiff file J111.tif.gz (2.6MB
compressed) 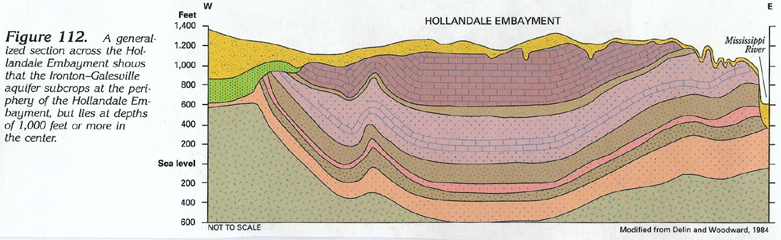 downloadable tiff file J112.tif.gz (1.8MB
compressed)
downloadable tiff file J112.tif.gz (1.8MB
compressed) 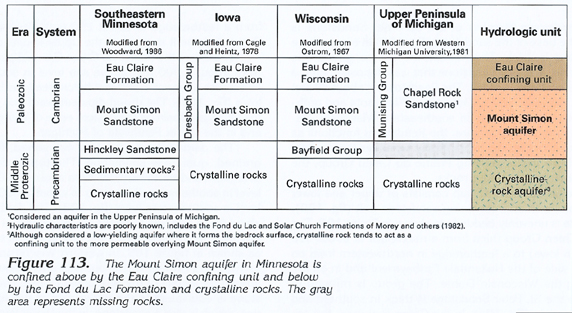 downloadable tiff file J113.tif.gz (1.2MB
compressed)
downloadable tiff file J113.tif.gz (1.2MB
compressed) 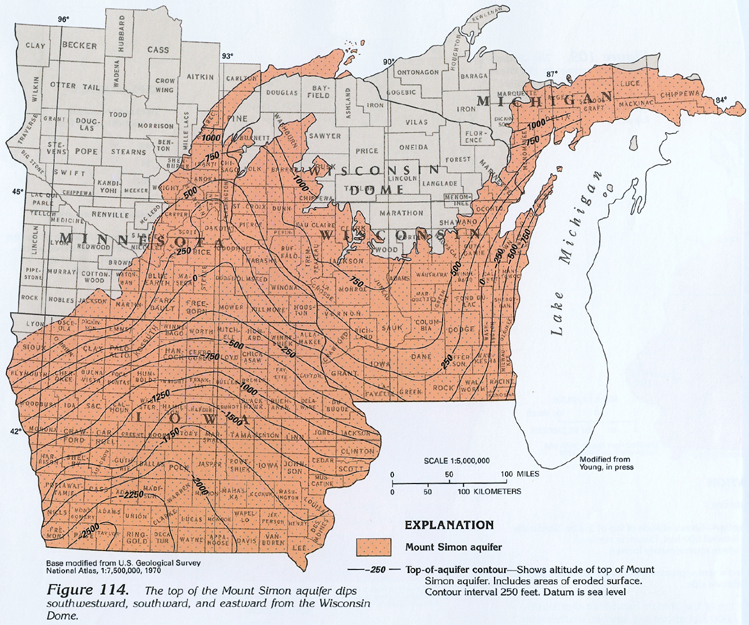 downloadable tiff file J114.tif.gz (4.3MB
compressed)
downloadable tiff file J114.tif.gz (4.3MB
compressed) 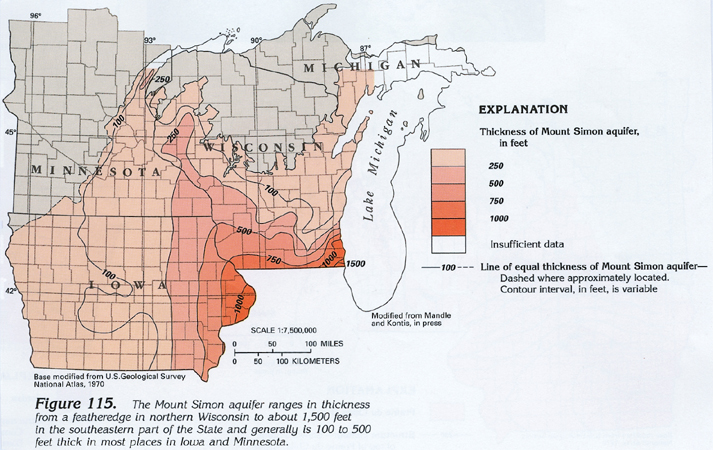 downloadable tiff file J115.tif.gz (2.6MB
compressed)
downloadable tiff file J115.tif.gz (2.6MB
compressed)