GROUND WATER ATLAS of the UNITED STATES
Iowa, Michigan, Minnesota, Wisconsin
HA 730-J
Cambrian-Ordovician aquifer system
There are two different files for each illustration
- A 90 ppi JPEG file, suitable for screen viewing is accessed
through the thumbnail image
- A tiff file is accessed through the "tiff file"
link. All files are Adobe Photoshop. These files have been compressed
with GNU's gzip utility. If your web browser defaults to a screen
display of the file, turn on the "Load to local disk"
option before downloading. Download and process these tiff files
as ascii, not binary.
Ground-water Flow
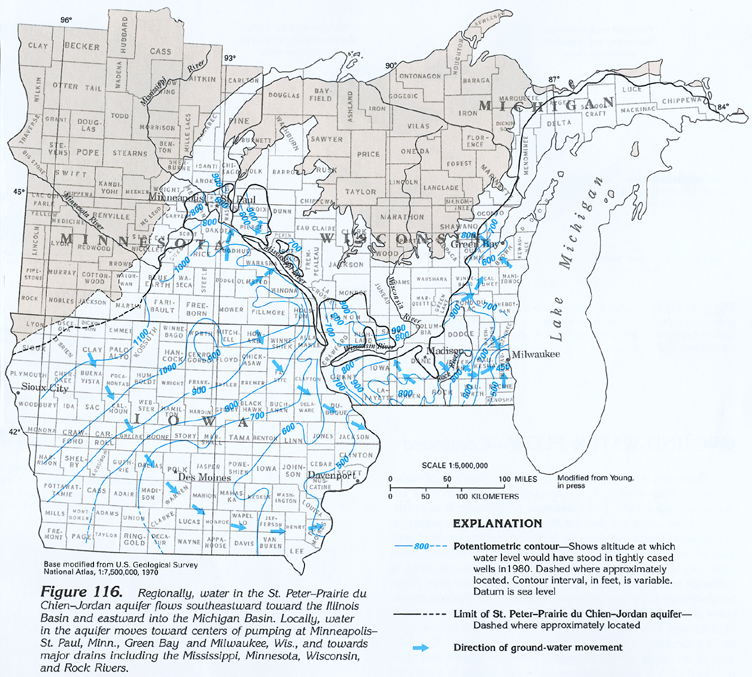
Figure 116 Map showing horizontal ground-water movement
in St. Peter-Prairie du Chien-Jordan aquifer (513K)
 downloadable tiff file J116.tif.gz (3.6MB
compressed)
downloadable tiff file J116.tif.gz (3.6MB
compressed)
Figure 117 Map showing vertical ground-water movement in southeastern
Minnesota (433K)
 downloadable tiff file J117.tif.gz (3.8MB
compressed)
downloadable tiff file J117.tif.gz (3.8MB
compressed)
Table 6 Table showing transmissivity values in the St. Peter-Prairie
du Chien-Jordan aquifer (211K)
 downloadable
tiff file Jtab06.tif.gz
(2.1MB compressed)
downloadable
tiff file Jtab06.tif.gz
(2.1MB compressed)
Figure 118 Map showing transmissivity of the St. Peter-Prairie
du Chien-Jordan aquifer in Iowa (200K)
 downloadable tiff file J118.tif.gz (1.6MB
compressed)
downloadable tiff file J118.tif.gz (1.6MB
compressed)
Figure 119 Diagram showing how transmissivity and confinement
affect aquifer water levels (433K)
 downloadable tiff file J119.tif.gz (3.8MB
compressed)
downloadable tiff file J119.tif.gz (3.8MB
compressed)
Figure 120 Diagram showing estimates of
principal inflow and outflow of water in the St. Peter-Prairie
du Chien-Jordan aquifer (138K)
 downloadable tiff file J120.tif.gz (1.2MB
compressed)
downloadable tiff file J120.tif.gz (1.2MB
compressed)
Figure 121 Map showing the predevelopment potentiometric surface
of the St. Peter-Prairie du Chien-Jordan aquifer in Iowa (238K)
 downloadable tiff file J121.tif.gz (1.9MB
compressed)
downloadable tiff file J121.tif.gz (1.9MB
compressed)
Figure 122 Map showing the 1974-1975 potentiometric
surface of the St. Peter-Prairie du Chien-Jordan aquifer in Iowa
(222K)
 downloadable tiff file J122.tif.gz (1.6MB
compressed)
downloadable tiff file J122.tif.gz (1.6MB
compressed)
Figure 123 Map showing the decline of the potentiometric
surface of the St. Peter-Prairie du Chien-Jordan aquifer in Iowa
(228K)
 downloadable tiff file J123.tif.gz (2MB
compressed)
downloadable tiff file J123.tif.gz (2MB
compressed)
Figure 124 Hydrographs of wells completed
in the St. Peter-Prairie du Chien-Jordan aquifer in Iowa (191K)
 downloadable tiff file J108.tif.gz (1.5MB
compressed)
downloadable tiff file J108.tif.gz (1.5MB
compressed)
Figure 125 Map showing the water level decline in the Cambrian-Ordovician
aquifer system in the Milwaukee-Chicago area (277K)
 downloadable tiff file J125.tif.gz (2.4MB
compressed)
downloadable tiff file J125.tif.gz (2.4MB
compressed)
Figure 126 Map showing potentiometric surface of the
Ironton-Galesville aquifer in 1980 (652K)
 downloadable tiff file J126.tif.gz (5.1MB
compressed)
downloadable tiff file J126.tif.gz (5.1MB
compressed)
Table 7 Table showing transmissivity values in several
Cambrian-Ordovician aquifers (63K)
 downloadable
tiff file Jtab07.tif.gz
(236K compressed)
downloadable
tiff file Jtab07.tif.gz
(236K compressed)
Table 8 Table showing comparison of water-level altitudes
in several Cambrian-Ordovician aquifers (68K)
 downloadable
tiff file Jtab08.tif.gz
(195K compressed)
downloadable
tiff file Jtab08.tif.gz
(195K compressed)
Figure 127 Map showing potentiometric surfaces of the
Mount Simon aquifer for 1980 (263K)
 downloadable
tiff file J127.tif.gz (4.1MB
compressed)
downloadable
tiff file J127.tif.gz (4.1MB
compressed)
Table 9 Table showing transmissivity values for the Mount
Simon aquifer (55K)
 downloadable
tiff file Jtab09.tif.gz
(198K compressed)
downloadable
tiff file Jtab09.tif.gz
(198K compressed)
 downloadable tiff file J116.tif.gz (3.6MB
compressed)
downloadable tiff file J116.tif.gz (3.6MB
compressed) 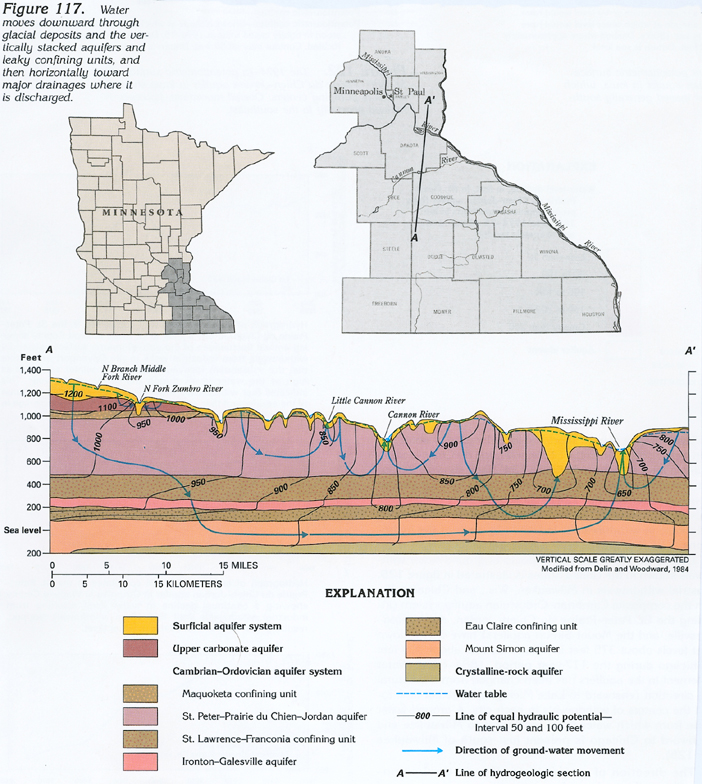 downloadable tiff file J117.tif.gz (3.8MB
compressed)
downloadable tiff file J117.tif.gz (3.8MB
compressed) 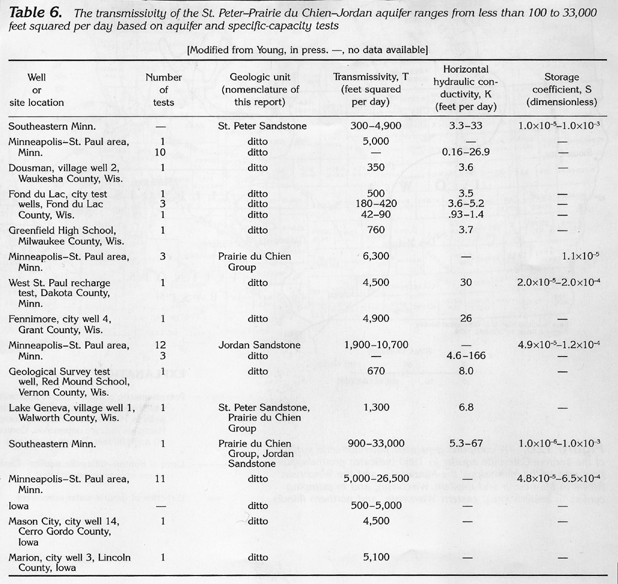 downloadable
tiff file Jtab06.tif.gz
(2.1MB compressed)
downloadable
tiff file Jtab06.tif.gz
(2.1MB compressed) 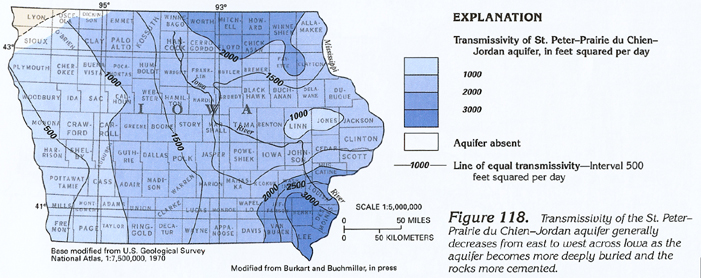 downloadable tiff file J118.tif.gz (1.6MB
compressed)
downloadable tiff file J118.tif.gz (1.6MB
compressed) 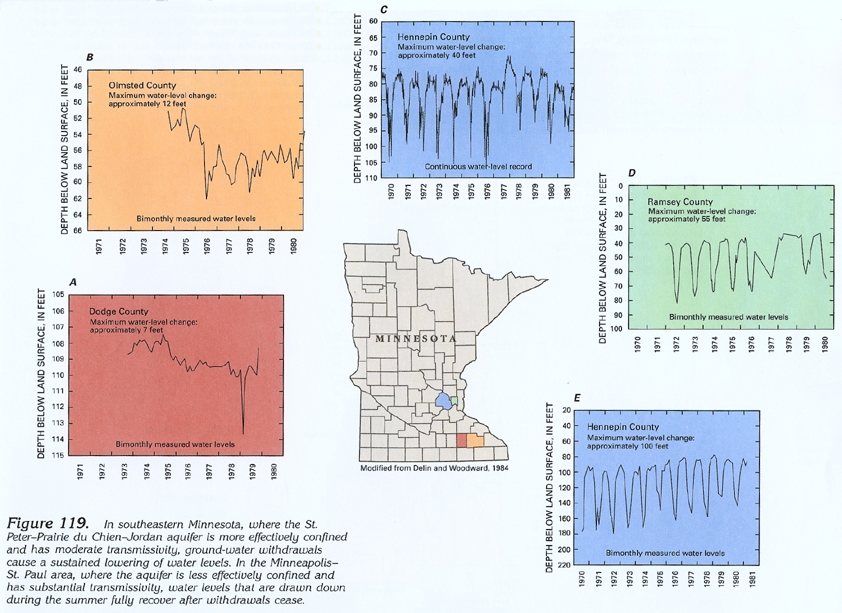 downloadable tiff file J119.tif.gz (3.8MB
compressed)
downloadable tiff file J119.tif.gz (3.8MB
compressed) 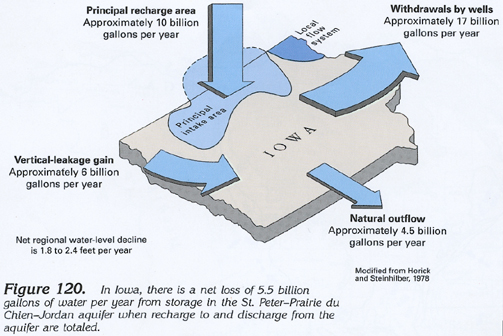 downloadable tiff file J120.tif.gz (1.2MB
compressed)
downloadable tiff file J120.tif.gz (1.2MB
compressed) 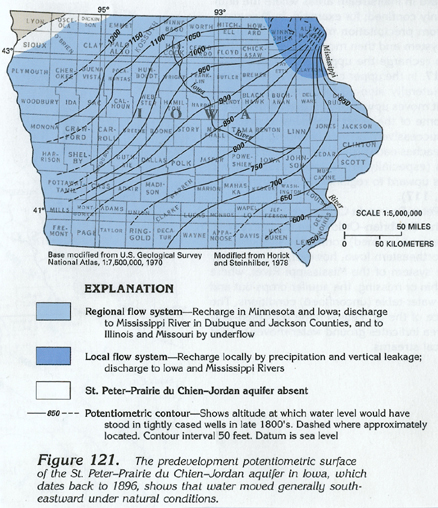 downloadable tiff file J121.tif.gz (1.9MB
compressed)
downloadable tiff file J121.tif.gz (1.9MB
compressed) 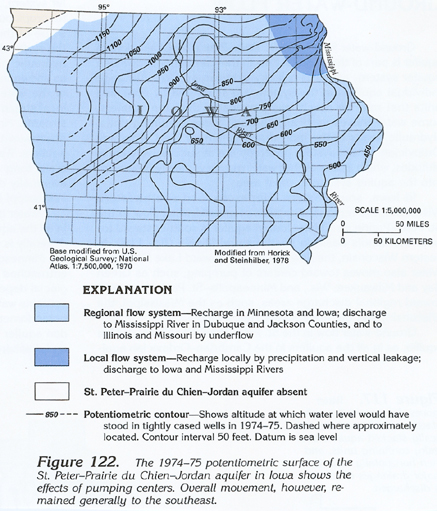 downloadable tiff file J122.tif.gz (1.6MB
compressed)
downloadable tiff file J122.tif.gz (1.6MB
compressed) 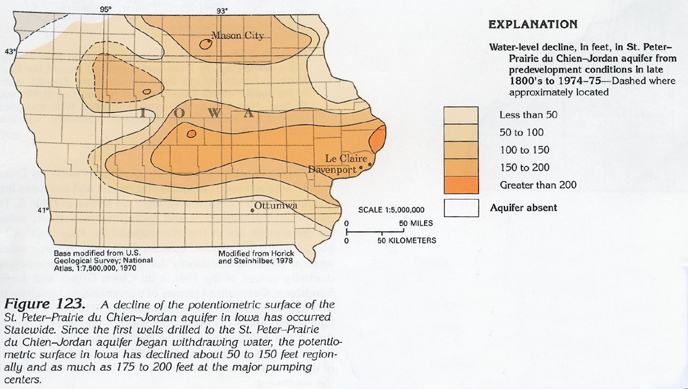 downloadable tiff file J123.tif.gz (2MB
compressed)
downloadable tiff file J123.tif.gz (2MB
compressed) 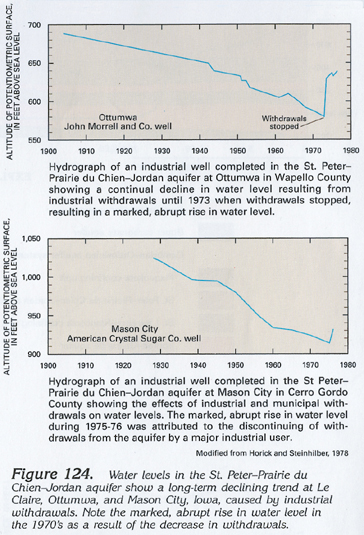 downloadable tiff file J108.tif.gz (1.5MB
compressed)
downloadable tiff file J108.tif.gz (1.5MB
compressed) 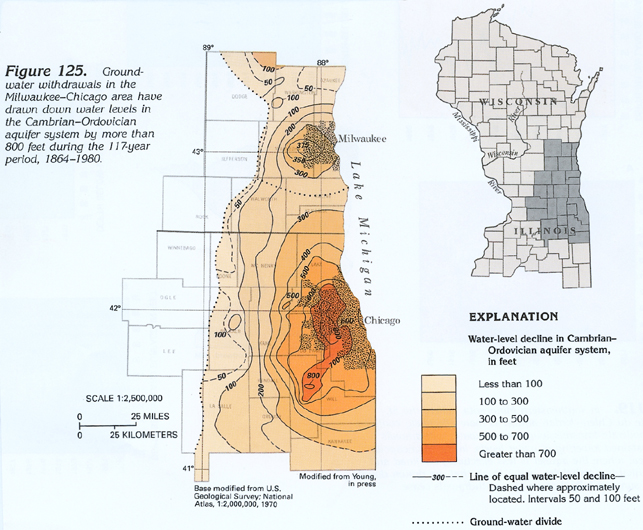 downloadable tiff file J125.tif.gz (2.4MB
compressed)
downloadable tiff file J125.tif.gz (2.4MB
compressed) 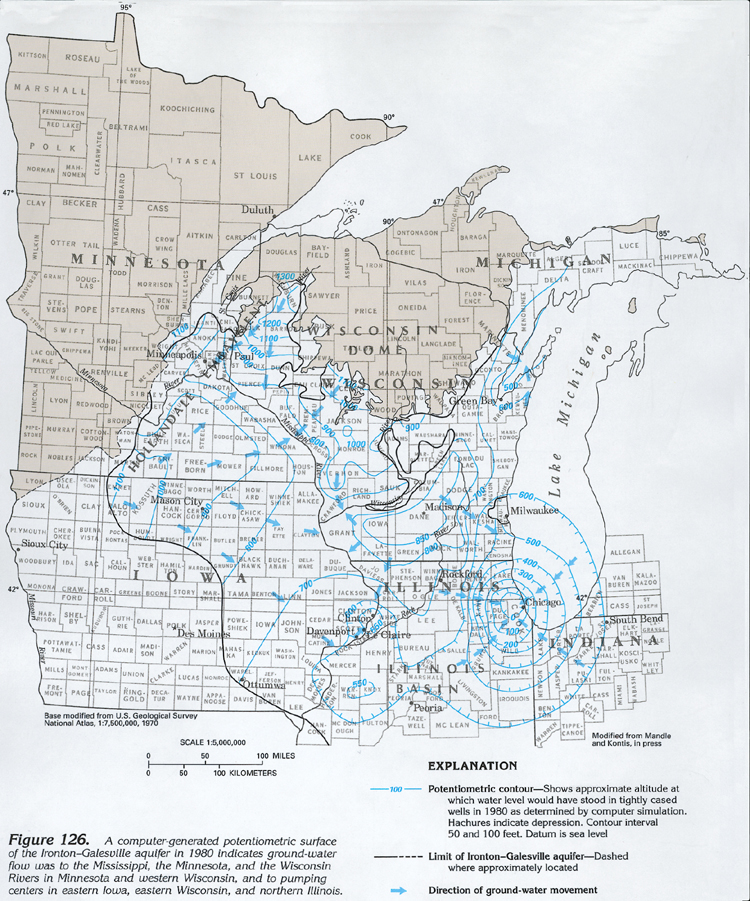 downloadable tiff file J126.tif.gz (5.1MB
compressed)
downloadable tiff file J126.tif.gz (5.1MB
compressed) 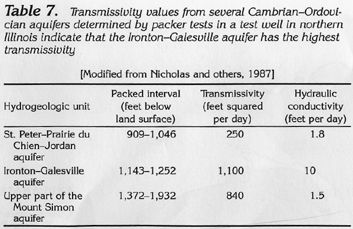 downloadable
tiff file Jtab07.tif.gz
(236K compressed)
downloadable
tiff file Jtab07.tif.gz
(236K compressed) 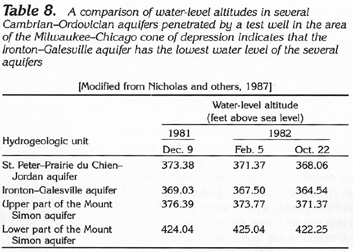 downloadable
tiff file Jtab08.tif.gz
(195K compressed)
downloadable
tiff file Jtab08.tif.gz
(195K compressed) 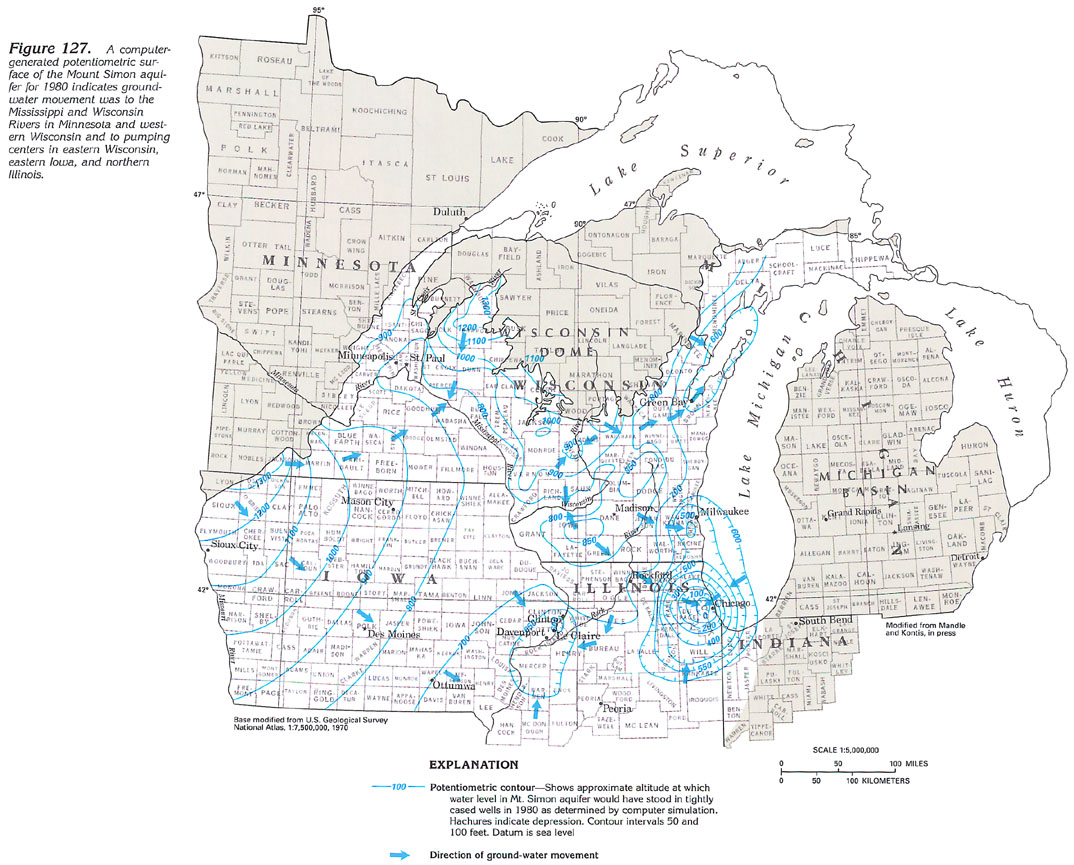 downloadable
tiff file J127.tif.gz (4.1MB
compressed)
downloadable
tiff file J127.tif.gz (4.1MB
compressed) 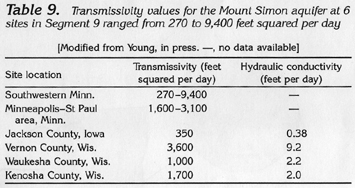 downloadable
tiff file Jtab09.tif.gz
(198K compressed)
downloadable
tiff file Jtab09.tif.gz
(198K compressed)