U.S. Geological Survey Miscellaneous Investigations Series Map I-2091-C
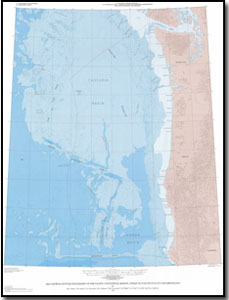
Data SourcesAll contours, geographic outlines, and political boundaries shown on this map of the bottom topography, or bathymetry, of the Pacific continental margin between 40° and 49°N. latitudes were plotted from digital data bases in the library of the U.S. Geological Survey (USGS)–National Oceanic and Atmospheric Administration (NOAA) Joint Office for Mapping and Research (JOMAR). These digital data were obtained and compiled from many sources; consequently. Data quality varies within particular data bases as well as from one data base to another. Bathymetric contours presented on this map were compiled from five sources: a published map (Chase and others, 1981), NOAA digital bathymetric data from the Juan De Fuca Ridge, NOAA digital bathymetric data from the continental slope off the coast of Oregon, and unpublished maps of the Gorda Ridge (M.L. Holmes, unpub. map, 1989) and the sea floor west of 130' W. (T.E. Chase, unpub. map, 1990). The areas of the map compiled from each of these sources are indicated in figure 1. For Area 1 (fig. 1) data used in the region seaward of the continental slope (~2000–m depth) were obtained primarily by the U.S. Coast and Geodetic Survey (C&GS) during the 1955 Pacific Exploratory Survey, a systematic and detailed (~8–nmi–trackline spacing) survey between Mexico and Canada. Data were also obtained from Scripps Institution of Oceanography (SIO) cruises Kayak E, Scan I, and Seven Tow (Chase and Menard, 1971; Wilde and others, 1977, 1978, 1979). The 200–m contour was derived from C&GS charts 1308N–12, 1308N–17, and 1308N–22 (Coast and Geodetic Survey, 1968a, 1968b, 1969). The data contoured in Area 2 (fig. 1) were collected by NOAA from 1980 to 1990 in support of ongoing plate–boundary dynamics studies. The research program, originally part of the National Ocean Service (NOS), later became the VENTS research program, based at NOAA's Pacific Marine Environmental Laboratory in Newport, Oreg. All data were collected using Sea Beam multi beam sonar systems. Area 3 (fig. 1) contours are based on high–resolution bathymetric data collected, to date, in about 45 percent of the conterminous United States Pacific Exclusive Economic Zone (EEZ) by the NOS using multibeam, swath–sounding techniques. When this map and two adjacent map panels were compiled, only the data from Area 3 were available for inclusion. The primary source of the data contoured in Area 4 (fig. 1) was the C&GS 1955 Pacific Exploratory Survey. Interpretation was aided by data from the USGS, the University of Washington, and SIO. Since compilation of the data from Area 1 (Chase and others, 1981), bathymetric surveys have revealed a high degree of roughness of the sea floor in the Pacific EEZ. In an attempt to depict this roughness, the contours in Area 4 have been drawn with a rippled appearance. The data contoured in Area 5 (fig. 1) were obtained in 1983 by the Hawaii Institute of Geophysics using the SeaMARC II swath–mapping system (Blackinton and Hussong, 1983). The survey, concentrated in the axial and near axial zone of the Gorda Ridge and in the eastern part of the Blanco Fracture Zone, was part of a USGS–Minerals Management Service cooperative study on mineral resources in the United States EEZ. These data were partially published by Clague and Holmes (1986). Area 5 was also surveyed as part of the VENTS program. Contours of those data were used to verify the contours from the SeaMARC II data. At adjoining boundaries, the various data sets were in very good agreement. Automated and interactive computer techniques were used to link contours between data sets where no adjustment was required for smooth joining of the contours. When an adjustment was needed, contours in the gaps between data sets were manually drawn, digitized, and interactively linked to the contours from adjacent data sets. NOS survey positioning was determined using the 1983 North American Datum (NAD 83) spheroid whereas the graticule for this map was calculated using the 1927 North American Datum (NAD 27) spheroid. At 1:1,000,000 scale, the difference between the two, which is approximately 100 m on the Earth's surface in the mapped area, is almost imperceptible. Onshore topographic contours were generated by computer from a modified version of 3–arc–second elevation data provided by the Defense Mapping Agency. The United States digital shoreline was obtained from the NOAA, NOS, Nautical Charting Division, National Atlas files. The coastline of Canada was digitized from Canadian Hydrographic Service bathymetric maps. The primary source of names of the sea floor features was the "Gazetteer of Undersea Features" (Defense Mapping Agency, 1990). AcknowledgmentsChristopher Hines and Krista Becker assisted in the construction and verification of the digital data bases. Reviews and suggestions by Edward C. Escowitz and Florence Wong and advice provided by Will Stettner regarding the cartographic design substantially improved the quality of this map. References CitedBlackinton, J.G., and Hussong, D.M., 1983, First results of a combination side–scan sonar and seafloor mapping system (SeaMARC II), Houston, Texas, May 2–5, 1983, Offshore Technology Conference, Proceedings, p. 307–314. Chase, T.E., and Menard, H.W., 1971, Bathymetric atlas of the northeastern Pacific Ocean: U.S. Naval Oceanographic Office Publication 1303, scale 1:2,000,000 at 33° latitude, 48 p. Chase, T.E., Wilde, Pat, Normark, W.R., Miller, C.P. , Seekins, B.A., and Young, J.D., 1981, Offshore topography of the Western United States between 32° and 49° North latitudes: U.S. Geological Survey Open–File Report 81–443, scale 1:864,518 at 38° latitude, 2 sheets. Clague, D.A. and Holmes, M.L., 1986, Geology, petrology, and mineral potential of the Gorda Ridge, in Scholl, D.W., Grantz, Arthur, and Vedder, J.G., eds., Geology and resource potential of the continental margin of Western North America and adjacent ocean basins — Beaufort Sea to Baja California, v. 6 of Circum–Pacific Council for Energy and Mineral Resources Earth Science Series: Houston, Texas, Circum–Pacific Council for Energy and Mineral Resources, p. 563–580. Coast and Geodetic Survey, 1968a, Umpqua River to Cape Ferrelo: Coast and Geodetic Survey Bathymetric Map 1308N–17, scale 1:250,000. Coast and Geodetic Survey, 1968b, Tillamook Head to Heceta Head: Coast and Geodetic Survey Bathymetric Map 1308N–22, scale 1:250,000. Coast and Geodetic Survey, 1969, Point St. George to Point Delgada: Coast and Geodetic Survey Bathymetric Map 1308N–12, scale 1:250,000. Defense Mapping Agency, 1990, Gazetteer of undersea features (4th ed.): Washington, D.C., Defense Mapping Agency. Wilde, Pat, Chase, T.E., Holmes, M.L., Normark, W.R., and Thomas, J.A., 1977, Oceanographic data off Washington 46° to 49° North including the Nitinat Deep Sea Fan: Berkeley, University of California, Lawrence Berkeley Laboratory Publication 223, scale 1:748,602 at 47° latitude. Wilde, Pat, Chase, T. E., Holmes, M.L., Normark, W.R., Thomas, J.A., McCulloch, D.S., Carlson, P.R., Kulm, L.D., and Young, J.D., 1979, Oceanographic data off Oregon 43° to 46° North including the Astoria Deep Sea Fan: Berkeley, University of California, Lawrence Berkeley Laboratory Publication 253, scale 1:776,073 at 45° latitude . Wilde, Pat, Chase, T.E ., Holmes, M.L., Normark, W.R., Thomas, J.A., McCulloch, D.S., and Kulm, L.D., 1978, Oceanographic data off northern California–southern Oregon 40° to 43° North including the Gorda Deep Sea Fan: Berkeley, University of California, Lawrence Berkeley Laboratory Publication 251, scale 1:815,482 at 42° latitude.
|
Map Collection
For additional information: This report is presented in Portable Document Format (PDF); the latest version of Adobe Reader or similar software is required to view it. Download the latest version of Adobe Reader, free of charge.
|
Grim, M.S., Chase, T.E., Evenden, G.I., Holmes, M.L., Normark, W.R., Wilde, Pat, Fox, C.G., Lief, C.J., and Seekins, B.A., 1992, Map showing bottom topography in the deep-sea basins of the Pacific continental margin, Strait of Juan de Fuca to Cape Mendocino: U.S. Geological Survey Miscellaneous Investigations Series Map I-2091-C, 1 sheet, scale 1:1,000,000.

![]() U.S. Department of the Interior |
U.S. Geological Survey
U.S. Department of the Interior |
U.S. Geological Survey
URL: http://pubsdata.usgs.gov/pubs/imap/2091/c/index.html
Page Contact Information: GS Pubs Web Contact
Page Last Modified: Wednesday, 30-Nov-2016 17:40:36 EST