
U.S. Geological Survey
Geologic Investigations Series Map I-2731-B
Version 1.0
2003
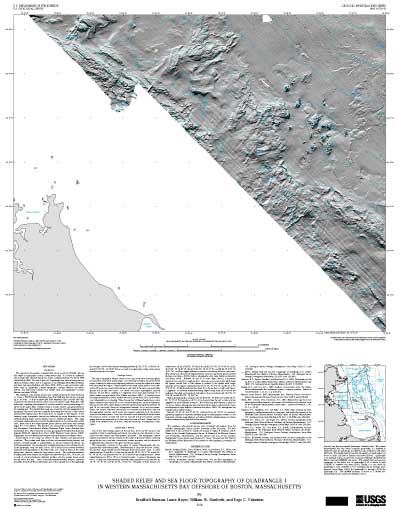
By Bradford Butman, Laura Hayes, William W. Danforth, and Page C. Valentine
|
Introduction This 27 x 35 inch map shows the sea floor in shaded relief view at a scale of 1:25,000, with sea floor depth as topographic contours overprinted in blue. It is based on multibeam echo-sounder data collected during four cruises conducted between the fall of 1994 and the fall of 1998. The map is part of a 3-quadrangle map series showing the area offshore of Boston, Mass., that is companion to the Stellwagen Bank National Marine Sanctuary map series (Valentine and others, 2001, 2003a-c; also see location map). Other maps of Quadrangle 1 depict topographic contours (Butman and others, 2003a), and backscatter intensity over shaded relief and topographic contours (Butman and others, 2003b). The multibeam echo-sounder surveys were conducted aboard the vessel Frederick G. Creed, a SWATH (Small Waterplane Area Twin Hull) ship that surveys at speeds up to 15 knots. A Simrad Subsea EM 1000 Multibeam Echo Sounder (95 kHz), mounted on the starboard pontoon of the Creed, was used to acquire these data. The bathymetric soundings were gridded at 6 m/pixel resolution and smoothed using a 9-cell by 9-cell median filter; contours having a 5-meter interval were generated from the resulting grid. The shaded relief image was created by vertically exaggerating the topography four times and then artificially illuminating the relief by a light source positioned 45 degrees above the horizon from an azimuth of 350 degrees. In the resulting image, topographic features are enhanced by strong illumination on the northward-facing slopes and by shadows cast on south-facing slopes. The image accentuates small features that could not be effectively shown by contours alone at this scale. Blank areas in the image represent places where no data exists; data coverage begins 6 to 7 km offshore. The shoreline was extracted from the National Oceanic and Atmospheric Administration Medium Resolution Digital Vector Shoreline (data downloaded from http://seaserver.nos.noaa.gov/projects/shoreline/shoreline.html, Segment EC80_05, digitized from Chart 13267 (National Ocean Service, 1997)). Topographic lows are identified by hachured contours (hachures face deeper water). Some features in the image are artifacts of data collection and environmental conditions. They include small highs and lows and unnatural-looking features, and patterns oriented parallel or perpendicular to survey tracklines (tracklines run northwest-southeast). For example, the wrinkle-like features in the northeastern part of the quadrangle, which are about 100 to 150 m long and are oriented northeastsouthwest and perpendicular to the ship's track, are a result of heave of the vessel during data collection caused by large surface waves. The northwest-southeasttrending raised linear features, for example noticeable near 42°19' N., 70°43' W., are a result of a Simrad hardware calibration problem with the acoustic beams aimed directly below the ship. Other northwest-southeast-trending features, especially noticeable along the shallow southwestern part of the mapped area of the quadrangle (for example, see the linear feature extending between 42°16.37' N., 70°40.79' W. and 42°15.63' N., 70°39.80' W.), are a result of marginal data overlap where survey lines were spaced too far apart. |
 |
| Thumbnail image of map I-2731-B |
Geologic Investigations Series Map I-2731-B [495-KB PDF file]
Download free Adobe Reader software.
Visit the Adobe accessibility website.
Contact Information
For questions about the scientific content of this report, contact Bradford Butman.
[an error occurred while processing this directive]