
Maps Showing Sea Floor
Topography, Sun-Illuminated
Sea Floor Topography, and Backscatter Intensity of
Quadrangles 1 and 2 in the Great South Channel Region,
Western Georges Bank
Page C. Valentine, editor
U.S. GEOLOGICAL SURVEY GEOLOGIC INVESTIGATIONS SERIES MAP I–2698
2002, Version 1.0
Prepared in cooperation with the National Oceanic
and Atmospheric Administration
METHODS OF ACQUIRING AND DISPLAYING SEA FLOOR DATA
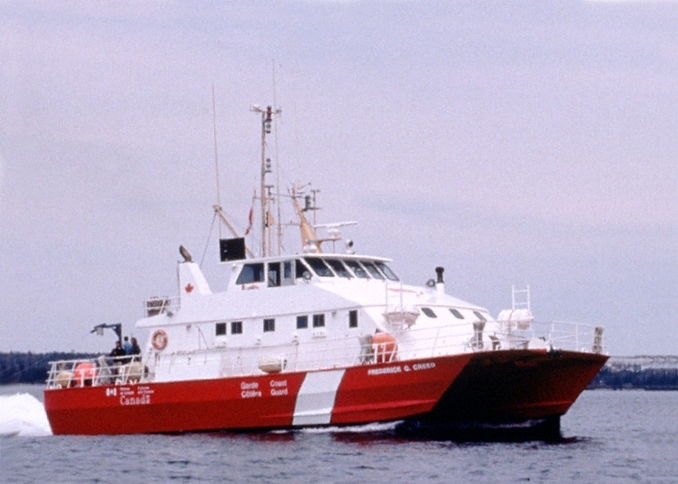
Survey vessel - Multibeam echo sounder data were collected aboard the Canadian Hydrographic Service vessel Frederick G. Creed, an aluminum SWATH (Small Waterplane Area Twin Hull) ship that surveys at speeds up to 15 knots. The ship has two submerged torpedo-shaped hulls that support the main deck via two thin struts from each hull. This design reduces wave motion on the ship and resistance to the ship's forward motion through the water, thus making it a very stable platform at high survey speeds. Stability of the ship is also enhanced by the computer-controlled action of four stabilizer fins located fore and aft on the inboard side of the hulls. The stabilizers control the pitch and roll of the vessel and allow adjustment of the heel and trim of the ship while under way.
The ship's position was determined with an accuracy of 10 m or better using a Magnavox 4200 global positioning system (GPS) receiver in conjunction with differential GPS corrections transmitted by U.S. Coast Guard radio beacons. At the start of each day, casts were made to record the sound velocity profile of the water column in the area to be surveyed. This information was used by the data acquisition system to correct for the refraction of the transmitted multibeam sound signal as it traveled through the water to and from the sea floor. Sound velocity information was updated during the day whenever the survey moved from one area to another. Tidal corrections based on the National Oceanic and Atmospheric Administration's (NOAA) Nantucket tide gauge were used to reference depth data to mean lower low water.
Multibeam data acquisition - The data presented here in the topographic and sidescan sonar backscatter images were collected utilizing a Simrad Subsea EM 1000 Multibeam Echo Sounder that is permanently installed in the hull of the Creed. The EM 1000 has 128 ceramic elements, operates at a frequency of 95 kHz, and surveys in water depths ranging from 5 to 1000 m. The raw data were logged on a Sun SPARCstation 10 using Simrad's Mermaid software and displayed on personal computers. When operating in water depths between 5 and 200 m, the EM 1000 produces 60 aimed beams spaced at intervals of 2.5 degrees, thus giving a total beam width of 150 degrees (75 degrees to each side of the vessel), which insonifies a strip of sea floor measuring in width approximately 7.5 times the water depth.
Signal processing methods that employ a combination of amplitude and phase detection were used to determine (for the patch of seabed under each formed beam) the distance between the hull transducer and the seabed. Values related to the strength of the returning signal for each beam were recorded and used to construct a composite seabed backscatter (reflectivity) image across the entire strip of insonified sea floor. Sounding rates depend on water depth but vary from 2 to 4 per second in water depths less than 100 meters. Horizontal spatial resolution at these sounding rates is on the order of 10 percent of the water depth at 15 knots; however, vertical resolution is approximtely 1 percent or better in the same depth range.
Both the bathymetric and the sidescan-sonar backscatter data were displayed in real time on the Sun workstation using software designed and written by the Ocean Mapping Group, University of New Brunswick. This display allows data gaps to be identified during the survey and also gives a measure of the data quality. An Applied Analytics POS/MV motion sensor located in the hull near the EM 1000 transducer detects changes in pitch, roll, and heave of the vessel. The motion information was recorded concurrently with the acquired multibeam signal and both were logged in a single file on the Sun workstation and made available to other workstations for further processing.
Data and image processing - After the echo sounder data were logged onto the hard disk of the Sun workstation, a suite of processing software developed by the Ocean Mapping Group was used to correct for artifacts and errors that may have been introduced during data collection. This software also enhanced the corrected data by resolving beam pattern and aspect ratio distortions and by imposing a linear contrast stretch before it generated bathymetric and sidescan sonar image mosaics in a Mercator projection.
All data processing described here was initiated using onboard Silicon Graphics workstations as soon as each acquisition file was closed by the Simrad Mermaid workstation (usually at the end of each survey trackline). As tidal information was not available in real time, tidal corrections were merged into the sounding data files at the end of the day for subsequent grid file generation. Tidal information is essential for mapping the depth information over the course of the entire survey because all depths are referenced to mean lower low water. The processing and editing steps on board the ship are as follows:
1. Demultiplex, or unravel, the acquired Simrad signal to generate separate files containing navigation, depth soundings, sidescan sonar backscatter values, and sound velocity information.
2. Automatically reject bad data. For the multibeam soundings, reject data outside expected depth ranges (operator's decision based on nautical chart data); for navigation data, reject fixes with poor GPS statistics.
3. Edit the navigation data on-screen to remove undesirable points, including turns at the ends of survey tracklines.
4. Edit the multibeam soundings on-screen to remove individual anomalous soundings.
5. Merge tidal information and the corrected navigation back into the data files. Tidal information from the Nantucket tide gauge was obtained via modem from computers maintained by the Ocean and Lake Levels Division of NOAA in Silver Spring, MD. The tidal database is updated by NOAA approximately every six hours.
6. Initiate UNIX c-shell script files that map the bathymetric soundings from each processed data file onto a Mercator grid with node spacings and scale selected by the operator.
7. Concurrently, UNIX c-shell script files map the extracted sidescan sonar backscatter values onto a digital mosaic in the Mercator projection at a scale selected by the user.
8. Generate sun-illuminated bathymetric raster files using the mapped grid node information to depict the depth information in a shaded relief view.
A Mercator projection allows individual map areas to be joined edge to edge when creating a composite image. The sun-illuminated image shown here uses a sun elevation angle of 45 degrees above the horizon from an azimuth of 0 degrees; a vertical exaggeration of four times is used to emphasize sea floor features.
Data archival - Raw data logged by the Simrad Mermaid workstation was backed up each day on Exabyte 8-mm tapes and then transcribed to CD-ROM's after the end of the survey for more permanent and stable storage. The map products and processed data files were also saved onto 8-mm tapes; they were transferred to magneto-optical read-write media for easier access in the event post-cruise processing was required.
Topographic Contours:
U.S. Geological Survey Geologic Investigations Series Map I–2698, Sheets A and C
Bathymetric data were contoured using the Arc/Info geographic information system software (Environmental Systems Research Institute, Inc., version 7.0.3). Processed data were formatted into a point file using the Arc/Info "point generate" routine. The point file was transformed to a Mercator projection, with the longitude of the central meridian at 68°55' W., and the latitude of true scale at 40°50' N. The "point grid" routine was used to create a grid from the point file and to assign depth values to individual grid cells. The cell size of the output grid was 9 m. Topographic contours at 5-meter intervals were generated using the "lattice contour" routine.
Most of the contour lines are displayed here unedited. However, in areas of very smooth sea floor, some contours displayed distortions that are due to problems encountered during data acquisition at nadir (directly below the vessel's keel) and to refraction effects at the outermost edge of the swath. These distortions were smoothed by employing a user-defined low-frequency "focal median" filter routine on the grid created by "point grid". A square focal median filter using a 3-cell by 3-cell size was used. The resulting contours were compared with features displayed in shaded-relief seabed imagery of the same data and were edited manually with "Arc/Edit" to remove small artifacts that remained after filtering. Each of the two quadrangles was contoured independently, and contours that extend into the adjoining quadrangle were edited manually to match at the boundary. These maps show contoured topography at an interval of 5 meters. Contours are shown in blue. The topographic contours are identical to those shown on Sheets B, D, and E of this report.
Sun-Illuminated Topographic Imagery:
U.S. Geological Survey Geologic Investigations Series Map I–2698, Sheets B and D
These maps combine contoured topography and sun-illuminated topographic imagery. The image shown here uses a sun elevation angle of 45 degrees above the horizon from an azimuth of 0 degrees and a vertical exaggeration of four times. In effect, topographic relief is enhanced by having the sun illuminate the sea floor from the north, so that shadows are cast on the southern flanks of seabed features. Unnatural-looking stripes and patterns oriented parallel or perpendicular to survey tracklines are artifacts of data collection. Blank areas (black on the image) represent places where no data exists. The topographic imagery is identical to that shown on Sheet E of this report.
Backscatter Imagery:
U.S. Geological Survey Geologic Investigations Series Map I–2698, Sheet E
Backscatter intensity (or reflectivity) of the seabed is combined here with sun-illuminated sea floor topographic imagery (shaded relief) at a scale of 1:25,000. For maps showing only sea floor topography or sun-illuminated sea floor topographic imagery, and for a description of survey and image processing methods, see the companion maps by Valentine and others on this CD-ROM. Unnatural-looking stripes and patterns oriented parallel or perpendicular to survey tracklines (which run north-south) are artifacts of data collection. Topographic lows are identified by hachured contours (hachures face deeper water). Blank areas (gray on image) represent places where no data exists.
Backscatter intensity is a measure of
the hardness and roughness of the sea floor as determined by the strength
of the sound waves reflected from the seabed during the survey (see backscatter
intensity scale bar). In the image shown here, backscatter intensity is
represented by a suite of eight colors ranging from blue, which represents
low intensity (soft bottom), to red, which represents high intensity (hard
bottom). The backscatter intensity data are draped over a shaded relief
image created by vertically exaggerating the topography four times and
then artificially illuminating the relief by a light source positioned
45 degrees above the horizon from an azimuth of 0 degrees. The resulting
image displays light and dark tones within each color band that are determined
by a feature's position with respect to the light source. For example,
north-facing slopes, receiving strong illumination, show as light tones
within a color band, whereas south-facing slopes, being in shadow, show
as dark tones within a color band. An interpretation of backscatter intensity
based on sediment sampling and video imagery of the sea floor in the mapped
area suggests that high backscatter values (6-7-8, yellow-orange-red)
represent gravel and sandy gravel. Moderate backscatter values (3-4-5,
green-yellow) represent sand and burrowed sand, and low backscatter values
(1-2, blue) denote clean, fine- to coarse-grained sand. Some areas display
relatively uniform levels of backscatter intensity, implying homogeneity
of bottom sediment. However, in other places the backscatter intensity
and bottom types are highly variable. For example, prominent east-west-trending
sand dunes are separated by troughs where gravel seabed commonly is exposed.
This is shown clearly by the backscatter intensity level, which ranges
from 1 to 2 (blue) on individual sand dunes and from 5 to 8 (green-yellow-orange-red)
on the sand, sandy gravel, and gravel between these features.
|
|