
Shaded Relief, Sea Floor Topography, and Backscatter Intensity of Massachusetts Bay and the Stellwagen Bank Region Offshore of Boston, Massachusetts
DISCUSSION
Introduction
These maps show the sea floor topography and backscatter intensity of the region offshore of Boston, Mass., at a scale of 1:125,000. Sheet 1 shows sea floor topography in shaded relief view, with sea floor depth superimposed in color. Sheet 2 shows sea floor topography in shaded relief view, with backscatter intensity superimposed in color. Both sheets also show smoothed topographic contours at selected intervals. The maps are based on multibeam echo-sounder data collected on four cruises conducted between the fall of 1994 and the fall of 1998. Additional sea floor bathymetry from the National Geophysical Data Center (NGDC) Coastal Relief Model and onshore topography from the U.S. Geological Survey (USGS) Digital Elevation Model (DEM) are also included. The maps combine multibeam echo-sounder data collected as part of the Stellwagen Bank National Marine Sanctuary map series (Valentine and others, 2001, 2003a–c) and the companion western Massachusetts Bay map series (Butman and others, 2003a-f). For a more detailed description of seabed features, see the maps at a scale of 1:25,000 for quadrangles 1-18 in the Stellwagen Bank National Marine Sanctuary map series, and quadrangles 1 and 2 in the western Massachusetts Bay map series (see location-map caption for references).
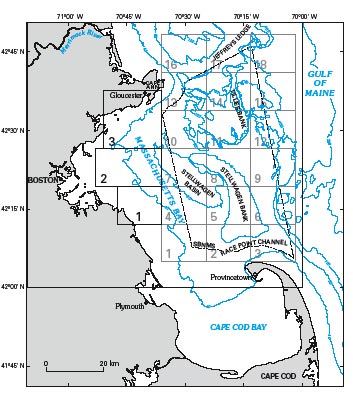 |
Location map showing the area of this study (heavy black line). Quadrangles 1–18 (outlined in gray) compose the Stellwagen Bank National Marine Sanctuary (SBNMS) map series. Quadrangles 1–3 (outlined in black) compose the western Massachusetts Bay map series. Sea floor topography, shaded relief, and backscatter intensity of the entire area of quadrangles 1–18 are shown at a scale of 1:60,000 in Valentine and others (2001, 2003a–c); shaded relief and sea floor topography are also shown by quadrangle at a scale of 1:25,000 in Valentine and others (1999) and as USGS Geologic Investigations Series Maps I–2701 (for quadrangle 1) through I–2718 (for quadrangle 18). Sea floor topography, shaded relief, and backscatter intensity of quadrangles 1 and 2 in western Massachusetts Bay are shown at a scale of 1:25,000 as USGS Geologic Investigations Series Maps I–2731 and I–2732, respectively (see Butman and others, 2003a–f). The SBNMS boundary is shown as a dashed line. Bathymetric contours are labeled in meters. |
The multibeam echo-sounder surveys were conducted aboard the Frederick G. Creed, a SWATH (Small Waterplane Area Twin Hull) vessel. A Simrad Subsea EM 1000 Multibeam Echo Sounder (95 kiloHertz (kHz)) was used to acquire these data. The data are presented at a resolution of 30 m/pixel on sheet 1 and 10 m/pixel on sheet 2.
The shaded relief image (sheet 1), colored according to water depth, was created by vertically exaggerating the topography four times and then artificially illuminating the relief by a light source positioned 45 degrees above the horizon from an azimuth of 350 degrees. To improve the dynamic range in the image, the 8-bit illumination values below 150 were set to 0, values between 150 and 200 were stretched between 0 and 255, and values above 200 were set to 255. In the resulting image, topographic features appear enhanced by strong illumination on the north-facing slopes and by shadows cast on south-facing slopes. The image also accentuates small features that could not be shown effectively by contours alone at this scale. The water depth, using a color scale from orange (shallow) to violet (deep), is superimposed.
The onshore topography on sheets 1 and 2 is from the USGS DEM (data downloaded from http://edc.usgs.gov/doc/edchome/ndcdb/ndcdb.html) at a resolution of 30 m/pixel. The data were regridded from the individual quadrangles to remove edge-matching problems. Topography for the Whitman 7.5- minute quadrangle (between lat 42°00' N., long 70°52.5' W. and lat 42°07.5' N., long 71°00' W.) is at a lower resolution and appears striped and blocky. The shaded relief image on land was created with the same illumination parameters as for the sea floor. To improve the dynamic range in the image, the 8-bit illumination values below 105 were set to 0 and values between 105 and 255 were stretched between 0 and 255. This stretch is slightly different from that applied to the offshore topography, and therefore the grayscale shaded relief images on land and offshore (sheet 2) are not directly comparable. The stretch preserves the range of variability in the land shaded relief, and produces a slightly darker image onshore. In addition, the onshore area on sheet 2 is overprinted with a light-brown tint to further differentiate the land from the offshore area. On sheet 1, the shaded relief topography is overprinted with a color scale that ranges from dark green (sea level) to light green (190 m above sea level). Lakes and rivers are colored dark blue (their locations were downloaded from MassGIS at http://www.state.ma.us/mgis/). Water bodies fringing the coast and inland where no topography was available are tinted gray. On both sheets the onshore topography is placed on top of the offshore topography, and therefore the shoreline reflects the USGS DEM.
Backscatter intensity (sheet 2) is a measure of surficial sediment texture and bottom roughness. Generally, high backscatter intensity is associated with rock or coarse-grained sediment, and low backscatter intensity characterizes finer grained sediments. Direct observations, using bottom photography or video and sampling techniques such as grab sampling or coring, are needed to verify interpretations of the backscatter intensity (see Gutierrez and others (2001) for photographs of the sea floor in western Massachusetts Bay). To improve the dynamic range of the backscatter image, the 8-bit backscatter values below 180 were set to zero, values between 180 and 225 were stretched between 0 and 255, and values above 225 were set to 255. In the image shown here, the stretched backscatter intensity is represented by a suite of eight colors ranging from blue, which represents low intensity (fine-grained sediments), to red, which represents high intensity (rock outcrops and coarse-grained sediments). These data are draped over the shaded relief image. The resulting image displays light and dark tones within each color band that result from a feature's position with respect to the light source. For example, north-facing slopes, receiving strong illumination, show as a light tone within a color band, whereas south-facing slopes, being in shadow, show as a dark tone within a color band.
On both sheets, sea floor topography from the NGDC Coastal Relief Model (National Geophysical Data Center, 1998) is shown in the nearshore area and in a band to the south, east, and north around the multibeam data. These data are a compilation of available historical bathymetric data gridded at a resolution of 90 m/pixel. The boundary between the new multibeam data and the historical data can be discerned by the sharp transition to increased small-scale detail in the multibeam data. Backscatter intensity (sheet 2) exists only for the area mapped using multibeam data (colored area); shaded relief, based on the NGDC Coastal Relief Model and without coloring for backscatter intensity, is shown by the gray tones in the area surrounding the multibeam data. In some areas the 90-m resolution of the NGDC Coastal Relief Model makes the data appear pixellated at this map scale in comparison to the higher resolution multibeam data (for example, see the area centered near 42°15' N., 70°45' W., and the area along the coast southwest of Cape Ann), and there are some individual data points that appear inconsistent with adjacent values (for example, in the area to the east of 70°02' W.). These inconsistent individual points, exaggerated in the shaded relief image, reflect the numerous data sources obtained at different times with different techniques and accuracies.
Smoothed bathymetric contours were created using ARC/INFO geographic information system software (Environmental Systems Research Institute, Inc., version 7.2.1). Smoothing of the multibeam data and the NGDC Coastal Relief Model bathymetric data over 270 m was accomplished using a median filter (9- cell by 9-cell area for the 30 m/pixel multibeam data, and 3-cell by 3-cell area for the 90 m/pixel Coastal Relief Model data) with the "focalmedian" routine. Topographic contours at 10, 20, 40, 60, 80, 100, 150, and 200 m were generated from the grid using the "latticecontour" routine. The contour lines were matched at the boundary between the multibeam and NGDC data sets, and contours that could not be resolved at the map scale were removed; otherwise the contours are displayed here unedited. For this reason, some discrepancies exist between the contours and the USGS DEM at places along the coast. Topographic lows are identified by hachured contours (hachures face deeper water).
Some features in the multibeam data (sheets 1 and 2) are artifacts of data collection and environmental conditions. They include small highs and lows and unnatural-looking features, and patterns oriented parallel or perpendicular to survey tracklines. The orientation of the tracklines is identified by the faint parallel stripes in the image. In some areas, the backscatter intensity image (sheet 2) shows stripes parallel to the survey tracklines, with high backscatter intensity in the inner part of the swath that abruptly drops to low backscatter intensity in the outer part of the swath. This effect is particularly noticeable in the Stellwagen Bank region (for example, see the area around 42°26.5' N., 70°19.0' W.) and in Race Point Channel. The striping is interpreted to be the result of a critical-angle effect, in which the reflectance of sound from the sea floor varies with the angle of incidence, producing high backscatter intensity where sound strikes the sea floor at a low angle from the vertical (in the inner part of the swath) and producing low backscatter intensity where sound strikes the sea floor at a higher angle from the vertical (in the outer part of the swath). Processing reduced but was unable to eliminate this striping. Some anomalouslooking backscatter intensity is the result of data collected during bad weather, for example the single high-intensity strip that runs northwest-southeast across the southern part of Stellwagen Bank. Areas of no data on the backscatter intensity image are tinted gray.
Geologic history
The major topographic features shown in the mapped area were formed by glacial processes that occurred in several stages. Ice containing rock debris moved across the region, sculpting its surface and depositing sediment to form the large basins, banks, ridges, and valleys that characterize the region. Some of the features are the result of processes at work when much of the area was covered with rotting ice, and when at the same time small valley glaciers and ice falls were active. Ice melting and marine submergence occurred between 18 and 14 thousand years ago (ka), resulting in a highstand of sea level approximately 33 m above modern sea level about 14 ka (Oldale and others, 1993). A lowstand of sea level approximately 45 m below modern sea level occurred about 12 ka as the Earth's crust rebounded from ice loading. Thus, the sea floor of Massachusetts Bay in water depths shallower than about 45 m was reworked during the marine transgression between 18 and 14 ka, again during a relatively rapid sealevel regression between 14 and 12 ka, and finally during the transgression between 12 ka and the present. Today, the surficial sediments and features are reworked and shaped by tidal and storm-generated currents, which erode and transport sediments from the shallow areas into the deeper basins. Over time, the shallow areas affected by these processes have become coarser as sand and mud are removed and gravel remains, and the deeper basins have been built up as they receive the winnowed sand and mud.
Features
One of the most striking aspects of the sea floor shown by this survey is the variability in bottom morphology and texture over scales of a few kilometers or less, caused by both natural and anthropogenic processes. The topography, surface features, and surficial sediment texture are the result of glacial processes, reworking during the last rise in sea level, reworking and transport by modern processes, and the disposal of dredged and other material in this region over the last century. These maps present a general description of the major features visible at a scale of 1:125,000; additional detail is visible in the 1:25,000-scale quadrangle maps (see location map and caption).
Stellwagen Bank
Stellwagen Bank lies between Cape Ann and Cape Cod and separates Massachusetts Bay from the western Gulf of Maine (location map). Approximately 40 kilometers (km) long, Stellwagen Bank in map view forms a gentle arc, curving from a north-trending alignment at its southern end to almost east-west at its northwestern tip. The bank is more than 20 km wide in the south, narrowing to less then 3 km in the northwest. The southwesternmost and shallowest part of the bank crest lies at a water depth of 20 m. The surface of Stellwagen Bank slopes eastward and westward from a broad, relatively flat central crest that extends to a depth of 25 to 30 m. In cross section, the bank is asymmetrical, with the steeper side facing west. The western flank of the bank slopes from a water depth of 30 m to meet the floor of Stellwagen Basin at a depth of 55 m in the south, increasing to a depth of 75 m in the north. Along this margin between about 42°10' and 42°20' N., the seabed is composed of large sheets of fine-grained sand that becomes gradually finer grained with increasing water depth. Where the bank margin is steepest (near 42°21.3' N., 70°20.85' W.), the water depth increases from 40 to 75 m over a distance of about 150 m. To the southeast, the bank margin is formed by the heads of valleys that extend eastward into deeper water. Long and narrow linear features in several of these valleys resemble lateral moraines (deposits of rock debris piled along the lateral margins of glaciers); these features are found on the southern or southeastern side of several banks (good examples are centered near 42°18.8' N., 70°06.3' W.; 42°15.9' N., 70°04.5' W.; and 42°13.0' N., 70°03.0' W.). On the eastern side, the bank slopes gently northeastward from 35 m to about 70 m water depth, and continues offshore to water depths of 80 to 100 m. Its surface is uneven and displays a variety of coarse sediment types and features, including sand, gravel, boulder piles and ridges, and a large northeast-trending sand bank (centered near 42°25.5' N., 70°11.7' W.) that is about 5 m in height. Between 70°24' and 70°26.5' W. at about 42°25.2' N., a sheet of fine-grained sand caps the northern edge of the bank where the northern flank slopes steeply through water depths of 50 to 90 m to form the head of a northwest-trending glacial valley.
Stellwagen Basin
Stellwagen Basin lies to the west of Stellwagen Bank. The sea floor is relatively smooth mud that slopes northeastward through water depths of 45 m in the west to 95 m in the east. The deepest water is found in two lows, one centered at 42°19.42' N., 70°23.60' W., and one centered at 42°19.27' N., 70°22.72' W. The most prominent features in the basin are four elongated banks, three of which are aligned with the large spur on the western margin of Stellwagen Bank. The fourth bank lies to the south, at 42°15' N., 70°29' W. The banks are 3.7 to 6.3 km in length, their tops lie in water depths of 55 to 65 m, and they have a relief of 15 to 30 m. The surfaces of the banks are sand and gravel, including boulder piles and ridges, and a thin veneer of mud. The internal composition of the banks is unknown. Their northwest-southeast elongated shape suggests formation by glacial processes that eroded surrounding less-resistant sediment and rock during ice movement toward the southeast. A large, broad, hummocky mound (centered near 42°21.6' N., 70°28.0' W.) is located north of the banks. Its surface is sand and gravel, including boulder piles, and a veneer of mud. This feature is interpreted to be a former bank in a later stage of erosion than the four banks that lie to the south. In addition to containing large banks that apparently are erosional in origin, the basin floor displays features that might be depositional in origin. Among these are small pear-shaped mounds that have a length of 375 to 900 m and a relief of 10 to 20 m (for example, see the feature centered near 42°23.55' N., 70°34.15' W.). They are rounded and streamlined in a northwestsoutheast direction and are interpreted to be drumlins (features composed of glacial sediment that were formed during ice movement). The mound of disposed material at the Massachusetts Bay Disposal Site is situated in the northwestern part of Stellwagen Basin, near 42°25.1' N., 70°34.5' W. High-backscatter-intensity material surrounds the central mound.
Jeffreys Ledge
The southern part of Jeffreys Ledge, shown on this map, is a broad, northeasttrending bank whose surface lies in water depths of 35 to 65 m. The bank is covered with high-backscatter-intensity material, primarily gravel and numerous boulder piles and ridges. Boulder ridges oriented northeastward, parallel to the trend of the bank, are located mainly along the western side of the bank. They resemble end moraines (deposits of rock debris piled up at the forward edge of glacial ice). Boulder ridges that trend southeastward, across the bank, resemble eskers (sand and gravel deposited by running water in channels within stationary glacial ice). The southeastern edge of the bank is capped by a narrow deposit of sand at a depth of 50 to 55 m (visible on sheet 2 as a green strip). The long, narrow, linear feature just to the southeast of this band (between 60 and 100 m depth and centered near 42°42' N., 70°20' W.) resembles a lateral moraine. The bank's western margin is a well-defined scarp, having 25 to 35 m of relief, that extends from 55 to 90 m water depth in the north and from 50 to 75 m water depth in the south. This margin is covered with sand and separates the bank from a basin of variable depth to the west.
Tillies Bank region
The Tillies Bank region, situated between Stellwagen Bank and Jeffreys Ledge, is topographically varied. It is characterized by banks and complex ridges whose tops lie in 60 to 90 m of water, separated by deep valleys and basins whose depths range from 125 to 195 m. The rugged topography displays a regional southeast-trending grain imposed by the direction of movement of the glacial ice sheet. Deep southeast-trending basins separate the banks and ridges. The relatively smooth basin floors are interrupted in some places by small elongate banks that are aligned with the basins (for example, at 42°30.4' N., 70°23.9' W.; and 42°32.5' N., 70°18.9' W.). The regional grain was modified during the late stages of the last glaciation by the movement of small valley glaciers and ice falls and by the melting of masses of stationary ice. Resulting topographic features include well-defined banks with steep flanks and flat tops, and complex ridges, also with relatively steep flanks, whose surfaces have been dissected by erosion into many small valleys and rounded hills. The flat-topped banks are covered with sandy gravel and gravel, including boulder piles and ridges. Many hummocky, lobe-shaped depositional features extend from the bases of banks and ridges into the adjacent valleys and basins. They are interpreted to have been formed by glacial debris that was deposited by ice falls that flowed from the elevated surfaces of the banks and ridges. Several good examples of ice-fall deposits lie on the perimeter of the large bank centered near 42°33' N., 70°24' W. Some of the boulder ridges resemble eskers. The valley floors (at 125-185 m water depth) are muddy sediment, except for some areas where sand has been transported into the valleys from neighboring banks.
Iceberg scour marks
In the northeastern part of the map area, the most striking topographic features are the many long, narrow grooves that dominate the region. They typically are 50 to 100 m wide, 2 to 4 m deep, and up to 5 km long, and they have a dominant northeast-southwest orientation. These grooves are interpreted to be marks made by the jagged bottoms of icebergs that gouged the seabed by grounding here during the late stages of the last glaciation. The iceberg gouges are first observed at a water depth of 145 m in the deeper northeastern part of the region, and they disappear in the 70- to 75-m depth interval to the west. The floors of many of the basins in this region (water depth greater than 120–125 m) are unmarked because icebergs would have grounded in the shallower surrounding area. Note that the iceberg scours are not resolved in the 90 m/pixel NGDC Coastal Relief Model topography (in the areas east of 70°02' W. or north of 42°48' N.).
Eskers
Eskers, the remnants of dendritic drainage channels formed through or beneath glacial ice, are observed on some of the bank tops. They are present as solitary features (42°29.5' N., 70°28.2' W.) and as networks of sinuous sharp gravel ridges. One of the best examples of a network of eskers is located about 7 km southeast of the coast of Cape Ann at a water depth of about 50 m in the area bounded by 42°32' N., 70°30' W. and 42°35' N., 70°36' W. Other, smaller networks of eskers occur on the crests of several banks to the south of this feature; for example, centered near 42°31' N., 70°32.4' W. The pattern on a ridge that runs approximately east-west, at about 42°21.5' N. between 70°43' W. and 70°49' W., may be indicative of an esker that was heavily reworked during the rise in sea level.
Race Point Channel
Race Point Channel is an east-west depression that lies in water depths of 45 to 60 m and separates Stellwagen Bank from Cape Cod to the south. The shallowest region of the channel floor is coarse-grained sand occurring as ripples and dunes in a discontinuous thin veneer on gravel. The deeper western and eastern parts of the channel floor are finer grained sand. The channel floor gradually deepens to the west, where it becomes muddy as it opens into Stellwagen Basin. Three distinct sets of low sand bedforms occur in the southern part of the channel. In the east (seaward), elongated dunes oriented along-current and parallel to regional topography extend around the northern face of Cape Cod. They merge with a western set of dunes (centered near 42°06.8' N., 70°10' W.) that is oriented across-current and perpendicular to the regional topography. A smaller, third set of bedforms, centered near 42°06.8' N., 70°12.5' W., is barely resolved at this scale. Both of the larger sets of bedforms are coarse-grained sand. The different orientations may reflect a difference in the speeds of tidal currents in the channel, with the eastern part experiencing the strongest currents. A smooth apron of coarse-grained sand extends from the northern flank of Cape Cod into the channel.
Inner shelf
West of about 70°40' W., the sea floor is characterized by a varying topography having relief of 10 to 15 m. North of about 42°23' N., the sea floor is shaped into a series of northwest-southeast-trending features. They are approximately 1 to 2 km long and 0.5 km wide, and they typically rise 5 to 10 m above the surrounding sea floor. Oldale and others (1994) examined 11 of these features in the region centered at 42°25' N., 70°48' W. (originally mapped by Bothner and others, 1992), and hypothesized that they are submerged drumlins. In general, their tops are smooth (that is, little texture is evident in the shaded relief image) in water deeper than 45 m, and rough in water shallower than 45 m. It is hypothesized that the rougher surface is the result of reworking and removal of fine material as sea level transgressed the region from its lowstand at –45 m.
Disposal sites
Six areas of the sea floor show the effects of ocean disposal of anthropogenic material. In the shaded relief view (sheet 1), these sites are typically identified by a low mound having an unnatural-appearing roughness that results from numerous individual dumps of material. In the backscatter intensity image (sheet 2), the sites are characterized by numerous small features, each having high backscatter intensity (for example, see areas 3 and 5 below). These features are most apparent in areas where the surrounding sediment has low backscatter intensity. The areas impacted by disposal are listed as follows:
(1) centered near 42°26.0' N., 70°48.0' W.;
(2) located between 42°24.5' N., 70°49.0' W. and 42°25.5' N., 70°50.0' W.;
(3) located between 42°21.0' N., 70°39.75' W. and 42°21.5' N., 70°40.5' W.;
(4) located between 42°19.5' N., 70°45.0' W. and 42°20.25' N., 70°46.0' W.;
(5) centered near 42°25.1' N., 70°34.5' W.;
(6) centered near 42°26.5' N., 70°34.0' W.
At all sites, the accumulation of material is a few meters higher than the surrounding sea floor. Areas 1 and 3 are within discontinued dumping grounds, as shown on National Ocean Service Chart 13267 (National Ocean Service, 1997), and area 2 is near the location of a former dumping ground buoy (Butman and Lindsay, 1999). Area 4 is located to the south of the previous location of the Boston Lightship. Area 5 is the Massachusetts Bay Disposal Site (see Valentine and others (1996) for a detailed description of the features of the Massachusetts Bay Disposal Site). Material in area 6 is rock debris from construction of the Ted Williams Tunnel in Boston.
Ocean outfall
The 50 individual diffuser heads for the new ocean outfall that discharges treated sewage effluent from the Boston metropolitan region into Massachusetts Bay extend between 42°23.06' N., 70°48.23' W. and 42°23.33' N., 70°46.81' W. The heads are located in 30 to 35 m of water in a topographic low; westnorthwest- trending ridges rise to about 25 m below the sea surface to the north and south. At this map scale the diffuser heads and two parallel rows of mounds of material, discarded on the sea floor from the holes drilled for the risers that extend to the outfall tunnel below, appear as a narrow east-northeast-trending double line about 2 km long. See Butman and others (2003e) for a more detailed image of these features.
Land features
Visually, the onshore topography appears rougher than the offshore topography, which has been smoothed by erosion caused by waves and currents and by deposition of sediments in basins during and since the last rise in sea level. Onshore, dominant positive features include bedrock outcrops that were exposed by glacial scouring and drumlins that are composed of rock debris deposited and molded by glacial processes. The highest topographic feature shown on land is an ancient volcano, Great Blue Hill, located near 42°13' N., 71°07' W., rising to about 190 m above sea level (Skehan, 2001). Drumlins are ubiquitous onshore. They are relatively smooth, streamlined hills whose direction of elongation indicates direction of ice movement, which in this region was southeastward. Good examples are in a broad area west of Cape Ann along a line extending between about 42°42' N., 70°48' W. and 42°32' N., 71°05' W.; in the area north of Boston Harbor between 42°20' N. and 42°25' N. near 71° W.; and on the Boston Harbor Islands (Skehan, 2001). Cape Ann, including the area to the southwest to about 70°52' W., is underlain by the Cape Ann pluton (Skehan, 2001), and is characterized by small, sharply defined hills separated by straight valleys that give the terrain a fractured look. Bedrock outcrops extend offshore of Cape Ann to the southeast, east, and northeast.
Acknowledgments
The multibeam echo-sounder surveys of the Stellwagen Bank National Marine Sanctuary region and western Massachusetts Bay were conducted in cooperation with the National Oceanic and Atmospheric Administration and with support from the Canadian Hydrographic Service and the University of New Brunswick. For their skillful work at sea, we thank G. Costello, N. Doucet, J. Gagne, R. Sanfacon, and B. Tessier of the Canadian Hydrographic Service, E. Radford of the National Oceanic and Atmospheric Administration, and the officers and crew of the Canadian Hydrographic Service survey vessel Frederick G. Creed. We also thank J. Hughes Clarke of the University of New Brunswick for his assistance in data acquisition, processing, and interpretation.
REFERENCES CITED
Bothner, M.H., Parmenter, C.M., Twichell, D.C., Polloni, C.F., and Knebel, H.J., 1992, A geologic map of the sea floor in western Massachusetts Bay, constructed from digital sidescan sonar images, photography, and sediment samples: U.S. Geological Survey Digital Data Series DDS–3, 1 CD-ROM.
Butman, Bradford, and Lindsay, John, eds., 1999, A marine GIS library for Massachusetts Bay focusing on disposal sites, contaminated sediments, and sea floor mapping: U.S. Geological Survey Open-File Report 99–439, 1 CD-ROM.
Butman, Bradford, Hayes, Laura, Danforth, W.W., and Valentine, P.C., 2003a, Sea floor topography of Quadrangle 1 in western Massachusetts Bay offshore of Boston, Massachusetts: U.S. Geological Survey Geologic Investigations Series Map I–2731–A, scale 1:25,000.
Butman, Bradford, Hayes, Laura, Danforth, W.W., and Valentine, P.C., 2003b, Shaded relief and sea floor topography of Quadrangle 1 in western Massachusetts Bay offshore of Boston, Massachusetts: U.S. Geological Survey Geologic Investigations Series Map I–2731–B, scale 1:25,000.
Butman, Bradford, Hayes, Laura, Danforth, W.W., and Valentine, P.C., 2003c, Backscatter intensity, shaded relief, and sea floor topography of Quadrangle 1 in western Massachusetts Bay offshore of Boston, Massachusetts: U.S. Geological Survey Geologic Investigations Series Map I–2731–C, scale 1:25,000.
Butman, Bradford, Hayes, Laura, Danforth, W.W., and Valentine, P.C., 2003d, Sea floor topography of Quadrangle 2 in western Massachusetts Bay offshore of Boston, Massachusetts: U.S. Geological Survey Geologic Investigations Series Map I–2732–A, scale 1:25,000.
Butman, Bradford, Hayes, Laura, Danforth, W.W., and Valentine, P.C., 2003e, Shaded relief and sea floor topography of Quadrangle 2 in western Massachusetts Bay offshore of Boston, Massachusetts: U.S. Geological Survey Geologic Investigations Series Map I–2732–B, scale 1:25,000.
Butman, Bradford, Hayes, Laura, Danforth, W.W., and Valentine, P.C., 2003f, Backscatter intensity, shaded relief, and sea floor topography of Quadrangle 2 in western Massachusetts Bay offshore of Boston, Massachusetts: U.S. Geological Survey Geologic Investigations Series Map I–2732–C, scale 1:25,000.
Gutierrez, B.T., Butman, Bradford, and Blackwood, D.S., 2001, Photographs of the sea floor of western Massachusetts Bay, offshore of Boston, Massachusetts, July 1999: U.S. Geological Survey Open-File Report 00–427, 1 CD-ROM.
National Geophysical Data Center, [1998], NGDC Coastal Relief Model, Volume 01, U.S. North East Atlantic Coast: [no place] National Oceanic and Atmospheric Administration, version 1.0, 1 CD-ROM. [For further information online go to http://www.ngdc.noaa.gov/mgg/coastal]
National Ocean Service, 1997, Massachusetts Bay: National Oceanic and Atmospheric Administration, National Ocean Service, Chart 13267, scale 1:80,000.
Oldale, R.N., Colman, S.M., and Jones, G.A., 1993, Radiocarbon ages from two submerged strandline features in the western Gulf of Maine and a sea-level curve for the northeastern Massachusetts coastal region: Quaternary Research, v. 40, no. 1, p. 38–45.
Oldale, R.N., Knebel, H.J., and Bothner, M.H., 1994, Submerged and eroded drumlins off northeastern Massachusetts: Geomorphology, v. 9, no. 4, p. 301–309.
Skehan, J.W., 2001, Roadside geology of Massachusetts: Missoula, Mont., Mountain Press Publishing Co., 378 p.
Valentine, P.C., Danforth, W.W., Roworth, E.T., and Stillman, S.T., 1996, Maps showing topography, backscatter, and interpretation of seafloor features in the Massachusetts Bay Disposal Site region off Boston, Massachusetts: U.S. Geological Survey Open-File Report 96–273, 2 sheets, scale 1:10,000 and 1:12,500.
Valentine, P.C., Unger, T.S., Baker, J.L., and Polloni, C.F., 1999, Sunilluminated sea floor topographic maps and perspective-view imagery of quadrangles 1–18, Stellwagen Bank National Marine Sanctuary off Boston, Massachusetts: U.S. Geological Survey Open-File Report 99–363, 1 CD-ROM, scale 1:25,000.
Valentine, P.C., Middleton, T.J., and Fuller, S.J., 2001, Sea floor maps showing topography, sun-illuminated topography, and backscatter intensity of the Stellwagen Bank National Marine Sanctuary region off Boston, Massachusetts: U.S. Geological Survey Open-File Report 00–410, 1 CD-ROM, scale 1:60,000.
Valentine, P.C., Baker, J.L., and Unger, T.S., 2003a, Sea floor topography of the Stellwagen Bank National Marine Sanctuary off Boston, Massachusetts: U.S. Geological Survey Geologic Investigations Series Map I–2676–A, scale 1:60,000.
Valentine, P.C., Unger, T.S., and Baker, J.L., 2003b, Sun-illuminated sea floor topography of the Stellwagen Bank National Marine Sanctuary off Boston, Massachusetts: U.S. Geological Survey Geologic Investigations Series Map I–2676–B, scale 1:60,000.
Valentine, P.C., Unger, T.S., and Baker, J.L., 2003c, Backscatter intensity and sun-illuminated sea floor topography of the Stellwagen Bank National Marine Sanctuary off Boston, Massachusetts: U.S. Geological Survey Geologic Investigations Series Map I–2676–C, scale 1:60,000.
U.S. Department of the Interior, U.S. Geological Survey
URL: https://pubsdata.usgs.gov/pubs/imap/i2734/text.html
For more information, contact
Maintained by Eastern Publications Group
Last modified: 17:38:38 Wed 30 Nov 2016
Privacy statement | General disclaimer | Accessibility