U. S. DEPARTMENT OF THE INTERIOR
U. S. GEOLOGICAL SURVEY
By
P.S. Powers, D.J. Varnes, and W.Z. Savage
U. S. Geological Survey Open-File Report 92-535
This report is preliminary and has not been reviewed for conformity with U.S. Geological Survey editorial standards. Any use of trade, product, or firm names is for descriptive purposes only and does not imply endorsement by the U. S. Government.
Denver, Colorado
1992
FIGURES
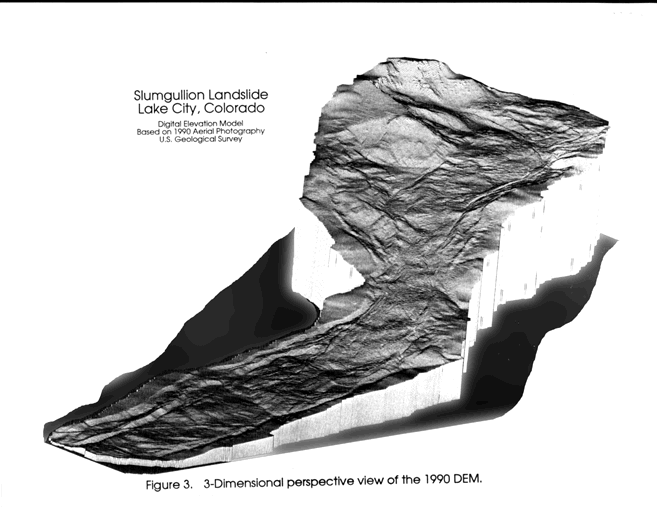
This report releases data on two digital elevation models (DEMs) of the active portion of the Slumgullion landslide surface, located near Lake City, Colorado. The data is available from our server. One model, based on 1990 aerial photography and 1991 photogrammetry by the U.S. Geological Survey, will be referred to as the 1990 DEM, and the other model, based on 1985 aerial photography and 1992 photogrammetry by IntraSearch of Englewood, Colorado, will be referred to as the 1985 DEM. The coordinate system is in meters and is based on the local control net surveyed by David Varnes and others (unpublished). Included with this report is a 3-dimensional view of the 1990 DEM showing the vertical detail of the slide surface. ( FTP site for DEMs)
INPUT DATA USED TO MAKE DEMs
The input data used to create the 1990 DEM was derived from 2-m interval contour data photogrammetrically produced on an analytical plotter by the U.S. Geological Survey from 1:6,000 scale aerial photography flown in August 1990. The contour data set consists of approximately 350,000 points. The X, Y, Z coordinates of these points are in meters and are without reference to any other coordinate system. The spacing of data points along a contour line averages 2 m or less. The X, Y, Z coordinates are photogrammetrically accurate to within 23 cm. The 1985 DEM was derived from 2-m interval contours created using 1:12,000 scale aerial photographs and an analog plotter connected to a personal computer. Both the DEM and the photogrammetric work were done under contract by IntraSearch, Inc. The coordinate spacing along contours averages 2 m or less. The X, Y, Z coordinates are accurate to within 42 cm. The photogrammetric work was performed on the 1985 photographs using a digitizing system by Dat em Systems International (Anchorage, Alaska) that incorporates a spline algorithm to create contours. These contours have a smoother appearance than contours produced by the U.S. Geological Survey on the 1990 aerial photographs. The 1:12,000 scale 1985 aerial photographs lack the detail of the 1:6,000 scale photographs taken during 1990.
METHOD USED TO CREATE DEMs
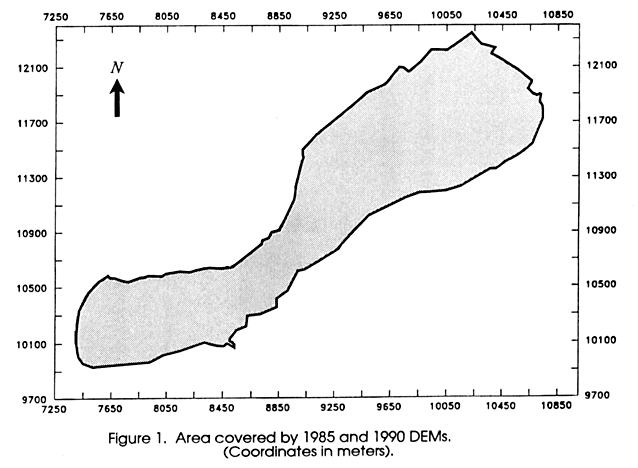
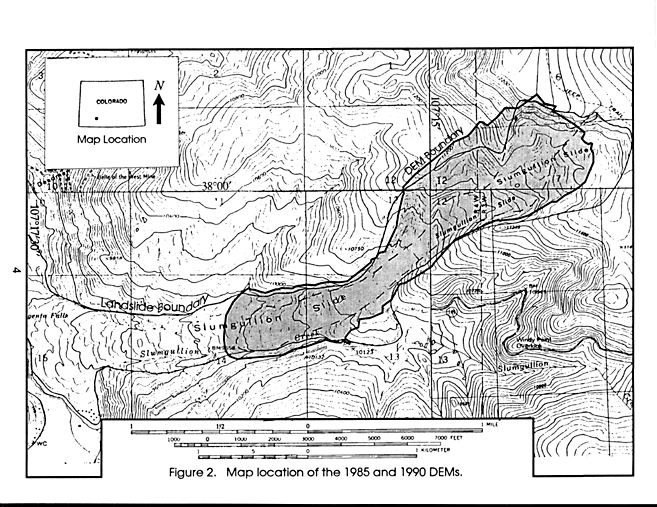
The 1985 and 1990 DEM models were generated under contract by IntraSearch, Inc., using the Quicksurf computer program by Schreiber Instruments. Quicksurf uses a method for terrain modeling that produces a surface with continuous slope and curvature and has all data points on the DEM surface. Both the 1985 and 1990 DEMs have 148,396 elevation values at identical X, Y coordinates spaced at 4 m. Figure 1 shows the area covered by the DEMs and the local coordinate system. The map location of the DEM coverage is shown in figure 2. An example of the detail of the DEMs is seen in figure 3, which is a 3-dimensional perspective view produced from the 1990 DEM.
DATA FILES
The DEMs are available for download from our server, each file is one compressed self-extracting file. The self-extracting file names are DEM85.EXE (1.28 Mb) and DEM90.EXE (1.28 Mb). The file sizes after decompression are 4.8 Mb each. The file names after decompression are named respectively, 1985.DEM and 1990.DEM (FTP site for DEMs).
The data files contain 148,396 lines of X, Y, and Z values formatted as follows:
10000.0000 10000.0000 1000.0000
10010.0000 10000.0000 1010.0000.
AccessibilityFOIAPrivacyPolicies and Notices