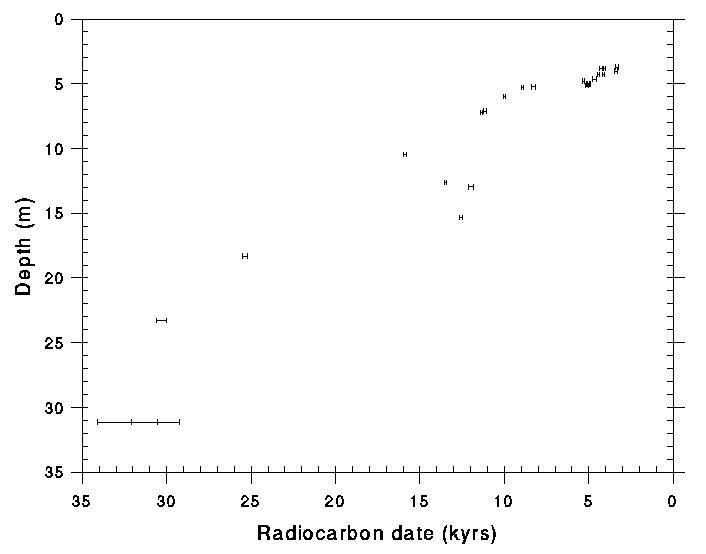
Chronological control on the core consists of radiocarbon dates for the top 25 meters (Bischoff et al 1993 a), and the identification of the Bishop Ash as at 304 meters (Sarna-Wojcicki et al, 1993), the identification of the Brunhes-Matuyama paleomagnetic reversal at 320 meters and a series of 11 paleomagnetic excursion-events between 20 and 269 m (Glen et al, 1993). These results show that the age versus depth relationship is not linear. I found that the mass-accumulation rate (MAR, g/cm2/kyr), however, was essentially the same for the portion of the core with radiocarbon control and for the entire core down to the Bishop Ash. If the MAR is indeed constant throughout the core, it allows for construction of a continuous age-depth curve down to the Bishop Ash. The age to any given depth can be calculated by estimating the mass of solids for various segments progressively down the core, using the measured pore- water content to estimate the masses of solid sediment. By this procedure starting from the top and extrapolating only from the radiocarbon data using the constant MAR assumption, the estimated age at the depth of the Bishop Ash was found to be within 10 kyrs of its true absolute age of 758 kyrs. The resulting age-depth relationship is derived independently of the paleomagnetic results, but when compared with the latter, it shows remarkable agreement. In what follows, I detail how the MAR age-depth curve was calculated and present a table of age-depth data useful for placing geochemical, sedimentological, and biological parameters of the core in a chronological context.
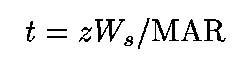
(1)
where W(s) is the mass of dry sediment per unit volume of wet sediment, z is the thickness of the sediment, and t is the time of accumulation. I first separately calculate W(s) for the radiocarbon segment (6 to 24 m) and for the Bishop Ash segment (6 to 304 m) from bulk density considerations, and then calculate MAR by multiplying each W(s) by its respective SR.
Bulk density is given by
(2)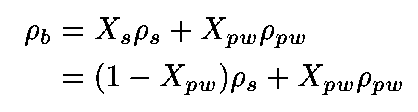
where rho is density, X is weight-fraction and subscript b refers to bulk, s to solids and pw to pore water.
The weight of solids in 1 cc of wet sediment (W(s)) is simply the weight- fraction of the solids times the bulk density:
(3)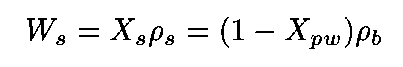
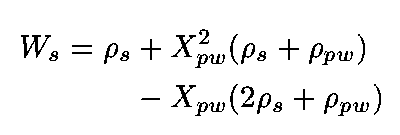
Substituting from (2)
(4)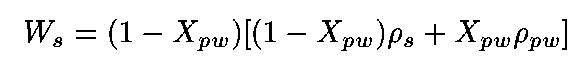
Rearranging:
(5)
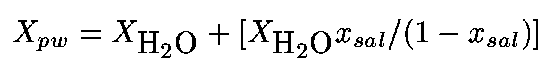
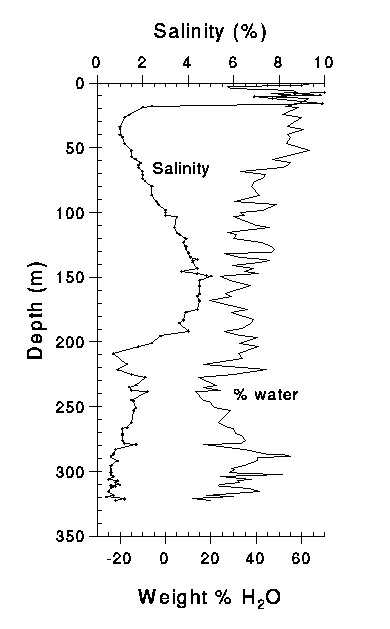
To calculate W(s) from parameters that were actually measured, expressions are needed for X(pw) and rho(pw) in terms of measured pore-water content, X(H2O), and measured salinity, x(sal), where X(H2O) is the weight fraction of H2O in the bulk sample, and x(sal) is the weight-fraction of salt in the pore-water. X(pw) is related to these variables by:
(6)
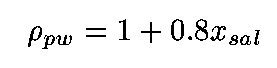
The density of the pore-water is primarily a function of its salinity, approximated by that for seawater (Sverdrup et al, 1942):
(7)
Averaged values for pore-water content and salinity for the two segments are given in Table 1, from which respective average W(s) is calculated using equations (5), (6), and (7). I then calculate average MAR for each segment from values in Table 1 as follows.
6 to 24m: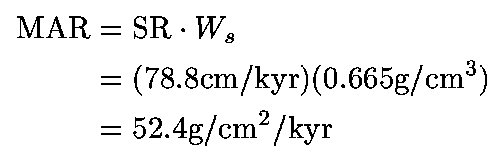 (8)
(8)
6 to 304m: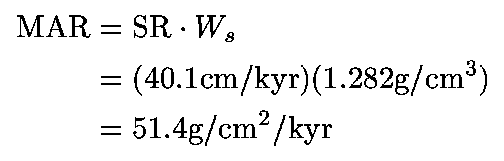 (9)
(9)
The agreement of average MAR for the two segments is remarkable. Such agreement was unexpected, particularly because the 6 to 24 m segment represents primarily maximum glacial conditions while the 6 to 309 m segment encompasses several glacial and interglacial cycles through which rates of MAR might be expected to vary. The next step is to construct a time-depth curve for the core down to the Bishop Ash based on the constant value for MAR and test for the reasonableness of the curve against independent criteria.
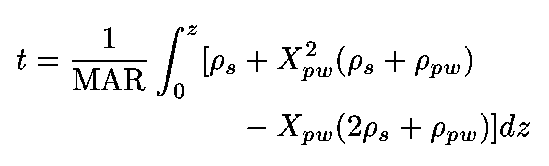
(10)
Taking MAR as constant and recognizing that W(s) varies widely:
(11)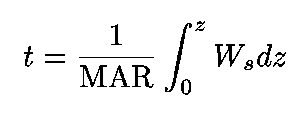
and substituting from (5)
(12)
If X(pw) could be expressed as an integrable function of depth such as a polynomial, it could be substituted into (5), and then (12) could be integrated to yield a general expression for t as a function of z. Unfortunately, as shown in Fig. 2, X(H2O) (and therefore X(pw)) varies erratically down the core and is not amenable to a polynomial fit. Therefore, I divide the core into small separate segments and use the technique of finite sums to estimate the age to any given depth:
(13)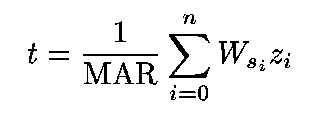
I subdivided the core into fifteen parcels, calculated an average W(s) from the average pore-water content and salinity for each parcel, and therefrom calculated the time of accumulation for each from equation (1). The time to any given depth is then calculated from (13). Fifteen segments divides the core into approximately 20m parcels, each of which is represented by 5 to 10 pore-water analyses. The resolution of the process could be increased by taking progressively smaller intervals, and based on the limiting number of pore-water samples, the number of parcels for the finite sum could be extended to 120 parcels. At increasingly smaller intervals, however, the assumption of constant MAR becomes less tenable and little is gained in precision. For the purposes of the present study, 15 parcels were broken out with boundaries taken at major changes in pore- water content (Fig. 2). Parameters for each of the 15 segments are listed in Table 2 with the calculated time span for each and a list of cumulative age to the bottom of each segment.
Results
The plot of cumulative age versus depth from the model (Fig. 4) is
generally smooth, but has some irregularities between 200 and 300 meters
where the massive sandy units interbed with fine-grained sediments (Smith,
1993). The points were fit by cubic spline (moving 3-point polynomial)
which reproduces each of the 15 derived ages within ±0.1 kyr. An expanded
table of ages versus depth (Table 3) was then generated from the cubic
spline fit using, as independent variable, the mid-point depths of the 85
channel samples used in the geochemical study (Bischoff et al, 1993c).
This table is the primary product of the exercise, and it is recommended
for use in interpolating the age for any given depth in OL-92. The age-
depth curve in Fig. 4 can also be described by a polynomial, albeit less
accurately:
(14)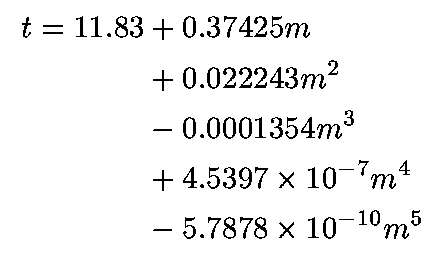
where t is in kyrs, m is in meters below the surface and is valid for m between 6 and 304 inclusive. The polynomial reproduces the derived ages within ±5 kyrs for 0 to 200 m and within ±10 kyrs for the lower 200 to 300m.
Discussion
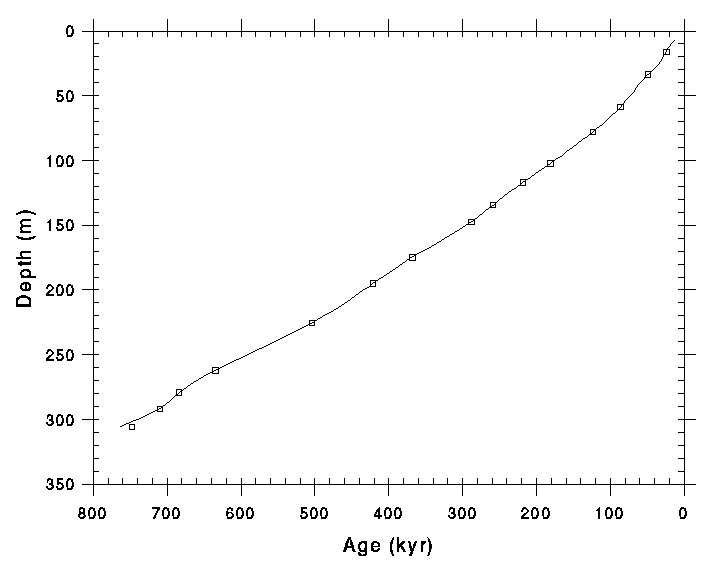
The reasonableness of the constant MAR model can now be evaluated via
comparison with the paleomagnetic data. Fig. 5 shows the MAR-derived age-
depth plot on which are superimposed the 11 paleomagnetic excursions
between the Bishop Ash and the surface, as recognized by Glen et al
(1993). The identification of these excursions was made assuming that the
section was continuous, and, therefore, was somewhat tentative.
Constraints on the ages of the excursions, as shown by the error bars on
Fig. 5, varies widely, from very close for some to rather broad for
others (see Champion et al, 1988). Nevertheless, the MAR plot passes
close to, or exactly on, the proposed age of each and all of the
excursions in what might otherwise appear to be a hand-drawn curve fit
through the excursion points. In fact, the excursion data appear to
provide no additional control, and therefore, cause no modification of the
derived position of the age-depth curve. These results, independently
derived, confirm the identification of the excursions, and actually
provides them with improved age control. The comparison clearly validates
the constant MAR model, and confirms the continuity and integrity of the
sedimentary section.
The age-depth curve can then be used to provide chronological control on other measured/observed parameters on the core. For example, the age- depth curve provides independent constraint on the ages of two ash layers found in core OL-92. Sarna-Wojcicki et al (1993) identified a tephra layer at 50.7 m which he correlates to one he previously found in sediments of Walker Lake, Nevada (previously estimated at ca 80 to 90 kyr) for which the present results indicate an age of 74.3 kyr. They also identified the Dibekulewe Ash at 224.2 m (only broadly constrained between 410 and 665 kyr) for which the present results indicates an age of 500.2 kyrs.
Variations in climatically controlled variables can also now be put in a chronological framework to allow regional and worldwide comparisons and correlations. For example, the variations in wt. % CaCO3 in the sediments over the past 300 kyrs is shown along with the SPECMAP (Imbrie et al 1984) d18O variations believed to represent variations in Northern-Hemisphere ice-volumes in Fig. 6. Interglacial conditions are characterized by high CaCO3 contents of closed-lake conditions, and glacial conditions by low CaCO3 content of lake flushing. The CaCO3 oscillations generally track and correlate with those of SPECMAP. For example, the abrupt warming event which marks the onset of the penultimate interglacial (Termination II) is clearly seen in Fig. 6 by the abrupt increase in CaCO3 content occurring at 117 kyr. According to SPECMAP estimate this event occurs at 128 kyrs. This 10 kyr difference reflects either the error in the age-depth model (i.e., 10% error), or alternatively, a real time-lag between changes in Northern Hemisphere ice-volumes and the manifestation of local climate change in lake geochemistry and sedimentology. Modifying the age-depth curve to coincide with the SPECMAP timing of Termination II, however, would require adjusting the curve to beyond that accomodated by the error bars of the Fram Strass and Blake paleomagnetic excursions of Glen et al (1993). Therefore, I conclude that the age-depth curve is accurate, which leads to the conclusion that rapid changes from glacial to interglacial conditions at Owns Lake occurred at about 117 kyr, a full 10 kyr later than the collapse of the polar ice sheet.
The constant MAR age-depth model obviously works rather well. Why this should be is rather puzzling. Firstly, its success confirms that the section is continuous and that no significant gaps occur in the record. Intuition would suggest, however, that accumulation rates would vary rather significantly between glacial and interglacial conditions. Interglacial conditions are characterized by abundant deposition of CaCO3, and glacial conditions by abundant deposition of mechanically transported silts and sands. That bulk MAR has remained relatively constant through the glacial/interglacial cycles can only mean that the increased sediment supply during the high run-off of glacial times is balanced by increased size of the depositional area, and vice-versa during interglacials.
    Averages for entire core to Bishop Tuff (6-304 m):

    SR     (sedimentation rate)  = 40.1 cm/kyr
    X(H2O) (pore water content)  = 0.372
    x(sal) (pore water salinity) = 0.0027
    rho(s) (grain density)       = 2.63g /cm3
    rho(b) (bulk density)        = 2.01 g/cm3
    CaCO3 content                = 12.5  wt %

    MAR  (mass sedimentation rate) = 51.4 g/cm2/kyr

    Averages for pre-Holocene radiocarbon-dated segment (6-24 m):

    SR     (sedimentation rate)  = 78.8 cm/kyr
    X(H2O) (pore water content)  = 0.548
    x(sal) (pore water salinity) = 0.00093
    rho(s) (grain density)       = 2.63 g/cm3
    rho(b) (bulk density)        = 1.68 g/cm3
    CaCO3 content                = 8.4 wt %

    MAR  (mass sedimentation rate) = 52.4g/cm2/kyr
    depth         = depth in meters to base of interval
    thickness     = z = interval thickness in meters
    water content = X(H20) = weight fraction of water in the bulk sample
    salinity      = x(sal)x100 = weight fraction of salt in the pore water
    rho(pw)       = pore-water density in g/cc
    rho(b)        = bulk density in g/cc
    zW(s)         = kg/cm2
    duration      = kyrs in interval
    age           = kyrs to base of interval


U.S. Department of Interior, U.S. Geological Survey
URL of this page: https://pubs.usgs.gov/openfile/of93-683/5-chronology/4-depth/depth.html
Maintained by: Eastern Publications Group Web Team
Last modified: 03.01.01 (krw)