Landslide Susceptibility in the Tully Valley Area,
Finger Lakes Region,
New York
USGS Open-File-Report 94-615 (On-line version)
Stefan Jäger & Gerald F. Wieczorek (addresses)
Disclaimer
This report is preliminary and has not been reviewed for
conformity with U.S. Geological Survey editorial standards (or with the North
American Stratigraphic Code). Any use of trade, product, or firm names is for
descriptive purposes only and does not imply endorsement by the U.S. Government.
Contents
Abstract
Introduction
Setting
- Glacial lake history in the Tully Valley study area
- Glacial lakes and late Pleistocene landslide processes
- Landslides in glacial lake deposits of New York
Methodology
Basic Data
- Landslide Inventory
- Digital Elevation Model (DEM)
- Soils
- Slope angle
Analyses
Conclusions
References
As a consequence of a large landslide in
the Tully Valley, Onondaga County, New York, an investigation was undertaken to
determine the factors responsible for the landslide in order to develop a model
for regional landslide susceptibility. The April 27, 1993 Tully Valley landslide
occurred within glacial lake clays overlain by till and colluvium on gentle
slopes of 9-12 degrees. The landslide was triggered by extreme climatic events
of prolonged heavy rainfall combined with rapid melting of a winter snowpack. A
photoinventory and field checking of landslides within a 415 km2 study area,
including the Tully Valley, revealed small recently-active landslides and other
large dormant prehistoric landslides, probably Pleistocene in age. Similar to
the larger Tully Valley landslide, the smaller recently-active landslides
occurred in red, glacial lake clays very likely triggered by seasonal rainfall.
The large dormant landslides have been stable for long periods as evidenced by
slope denudational processes that have modified the landslides. These old and
ancient landslides correspond with proglacial lake levels during the
Pleistocene, suggesting that either inundation or rapid drainage was responsible
for triggering these landslides. A logistic regression analysis was performed
within a Geographic Information System (GIS) environment to develop a model of
landslide susceptibility for the Tully Valley study area. Presence of glacial
clays, slope angle, and glacial lake levels were used as explanatory variables
for landslide incidence. The spatial probability of landsliding, categorized as
low, moderate and high, is portrayed within 90-m square cells on the
susceptibility map.
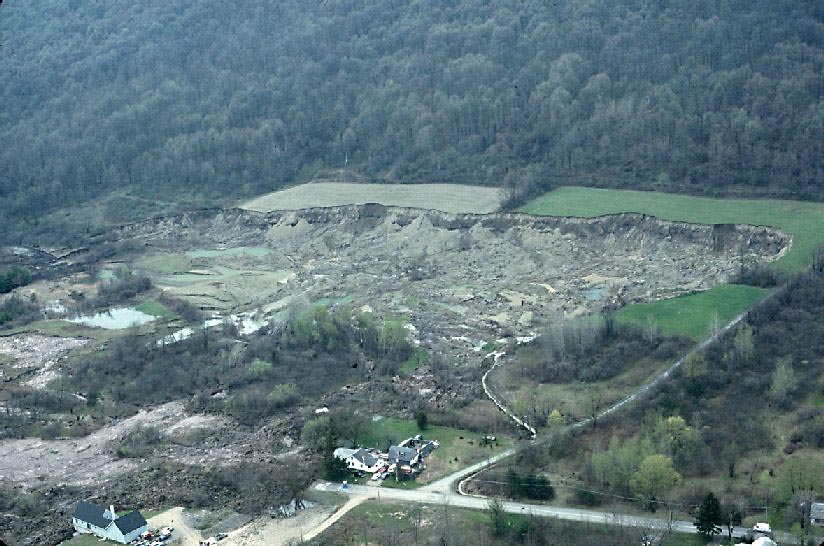
On April 27, 1993, a landslide severely damaged three homes
near the town of LaFayette in the Tully Valley, 24 km (15 miles) south of
Syracuse, New York (Fig. 1). Four additional homes had to be evacuated. This
landslide, which occurred after heavy precipitation of 190 mm (7.5 in) during
April in conjunction with melting of a winter snowpack, led to considerable
concern among the local authorities as well as the population about the stability
of the slopes in the Finger Lakes region. The Tully Valley landslide was the
largest in New York in the past 75 years (Fickies, 1993). The scarp is approximately
450 m (1500 feet) wide and the landslide measures 600 m (1800 feet) from crown
to toe (Fig. 2) . The toe of the landslide overrode
Tully Farms Road and destroyed 22 hectares (55 acres) of farmland (Fickies,
1993). This landslide can be classified as a rapid slump-earth flow according
to the terminology of Varnes (1978). Material involved in this landslide mainly
consists of red lake clay deposits of glacial origin, covered by glacial till
and colluvium of varying thickness.
Figure 1: Location (fast)
(16 kb)
An initial reconnaissance revealed that the Tully Valley landslide was not
a unique geologic event in this area; immediately north of this landslide
a similar scarp indicates another landslide of the same type and roughly the
same size that is probably at least 200 years old. In a cooperative effort,
Stefan J„ger of the Department of Geography at the University of Heidelberg,
Germany and Gerald F. Wieczorek of the U.S. Geological Survey, undertook to
examine landslide susceptibility and causative factors in a study area of
approximately 415 km2 around Otisco Lake, Tully Valley and Butternut Valley
(Fig. 1).
The initial step of the investigation was the preparation of a landslide inventory
based on interpretation of aerial photographs. This inventory was field checked
and modified on the basis of field examination. The landslide inventory and
other geologic data sets were digitized and converted into spatial coverages
for statistical analyses within a Geographic Information System (GIS) environment
and for development of a landslide susceptibility model. The final results
are displayed as a map of landslide susceptibility for the Tully Valley study
area, but the results could be extended to areas of similar geologic conditions.
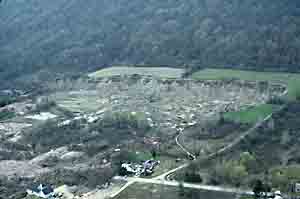
Figure 2: Photograph of the Tully Valley landslide,
taken from helicopter shortly after its occurrence on April 27, 1994.
(112 kb)
The Tully Valley is located in the northern
end of the Allegheny Plateau at the drainage divide of the Susquehanna and the
St. Lawrence Rivers. Lower Devonian shales and limestones dip gently to the
south throughout the area. Several stages of late Pleistocene glaciation have
left both prominent erosional and depositional glacial features in this area
(Andrews and Jordan, 1978).
Landslides in glacial lake deposits of New York
The glacial geology and
geomorphology of the Finger Lakes region have been studied for more than a
century (Fairchild, 1898; 1899; von Engeln, 1928). A study of the glacial
geology is important for the recognition of glacial landforms and distinction of
landslides. A review of the geological literature indicates relatively few
investigations of landslide processes in the Finger Lakes region. Newland (1909,
1916) investigated landslides in clays and unconsolidated sediments of the
Hudson River Valley, an area covered by glacial Lake Albany, which is about 240
km (150 mi) east of the study area. More recently Dunn and Banino (1977) have
described slope stability problems with Lake Albany clays. Robak and Fickies
(1983) prepared a landslide susceptibility map for the Hudson River Valley.
Fickies and Brabb (1989) prepared a landslide inventory map of New York State
from historical reports at a scale of 1:500,000 which identified four small
recently-active landslides within the Tully Valley study area.
Glacial lake history in the Tully Valley study area
The glacial lake history in the Tully Valley study area is closely
related to the lake history of the other adjacent Finger Lakes valleys. During
the Late Pleistocene different stages of advance and retreat of the Wisconsin
ice sheet blocked northward drainage forming proglacial lakes between the
ice margin and moraines deposited further south. Based mainly on the work
of Fairchild (1898, 1899, 1934a, 1934b), who published more than 100 papers
related to the glacial lake history of central New York, Grasso (1970) published
a detailed description of the proglacial lake sequence in the Tully Valley.
Blagbrough (1951) studied the lake sequence in Otisco Valley in relation to
red clay deposits.
Two types of glacial lakes covered the Tully Valley area. During stages of
stagnant ice margins north of the valley, water backed up into the Tully Valley
that connected with larger lakes to the northwest, these lake stages are referred
to by various names, e.g. Newberry, Warren, and Dana (Fairchild, 1898). During
stages of ice advance further southward, smaller lakes formed which were more
locally controlled within individual valleys. To the south the drainage of
the Tully Valley was blocked by the Valley Heads moraine, a prominent ridge
near the Tully Lakes (Fig. 1). When the ice front melted back from the Valley
Heads Moraine at Tully, Lake Cardiff was formed in Tully Valley south of the
ice front and north of the moraine (Grasso, 1970). Glacial Lake Otisco existed
in the next valley to the west. The shoreline of these two contemporaneous
lakes within the study area is shown as Lake Otisco-Cardiff on Plate 5. Subsequently, glacial lake levels lowered as the
glacial ice retreated further northward and outlets drained to adjacent valleys.
Lake Heath Grove and First Lake Marietta were subsequent lakes in the study
area (Plate 5).
Plate 5:
(49 kb)
These glacial lakes trapped sediment eroded by the ice as well as carried
by the rivers. Thick deposits of fine-grained sediments, including red clays,
are common throughout the Finger Lakes region in areas covered by glacial
lakes; however, in many places these glacial lake deposits are mantled by
colluvium. Near the intersection of Tully Farms Road and Nickols Road, immediately
south of the Tully Valley landslide the massive red clay deposits are at least
21 m (70 ft) thick. Although the beds of these lake clays are predominantly
horizontal they may have a slight tilt where they lapped along the valley
edge. Laboratory tests indicate that these lacustrine "clays" are mostly clayey
silts of moderate plasticity (Bill Kappel, U.S. Geological Survey, 1993, written
commun.).
Glacial lakes and late Pleistocene landslide processes
The occurrence of
landslides in the study area is influenced by at least several causative
factors, including the location of previous glacial lakes. Glacial lake
deposits, particularly clays, are generally highly susceptible to landsliding.
The surface of rupture of the Tully Valley landslide was within red, glacial,
lake-clay beds overlain by colluvium. Many of the recently-active landslides
observed in the study area occurred within red clay beds, although most of these
landslides were smaller and shallower than the Tully Valley landslide. The
generally low shear strength of clay facilitates sliding on even moderate
slopes. The initial surface slope of the crown area of the Tully Valley
landslide was between 9 and 12 degrees, within the range of reported friction
angles of clays (Skempton, 1964).
The sensitivity of clays, the ratio of
peak to remolded strength, is an important factor influencing the behavior of
glacial clays. The Tully Valley clays had only slight to medium sensitivity
(1.7-3.9), and exhibited limited mobility near the toe of the landslide where
they flowed around a house and over Tully Farms Road. In contrast some glacial
marine clays of Canada and Scandinavia with high sensitivity (8 to >64) are
subject to sudden collapse and mobilization into very rapidly moving landslides
(Karlsrud et al., 1984; Tavenas, 1984).
High pore water pressure reduces
shear strength and is a major mechanism responsible for triggering landslides,
as observed in glacial clays of the Cincinnati area (Fleming et al., 1981).
Ohlmacher and Baskerville (1991) described landslides in fine-grained glacial
deposits of Lake Hitchcock, Vermont triggered by elevated pore-water pressures
during heavy precipitation. After the Tully Valley landslide movement, water
rapidly flowed from the main scarp forming ponds on the body of the landslide;
artesian pressures existed below the lacustrine clays and high pressures also
existed in the overlying colluvium (Bill Kappel, U.S. Geological Survey, 1994,
written commun.).
The filling and rapid emptying of Pleistocene glacial
lakes could have triggered landslides in the Finger Lakes region. Raising ground
water levels within a hillside during filling of a lake increases pore-water
pressures and reduces slope stability (Jones et al., 1961). Likewise, rapid
drawdown of a lake can temporarily reduce slope stability by temporarily leaving
high pore pressures in slow draining materials (Lambe and Whitman, 1969;
Schuster, 1979). The initial filling of Yellowtail Reservoir, Montana, and the
Panama Canal, were cited by Lane (1967) as examples in which large landslides
were triggered by initial raising of the water levels on natural or cut slopes.
The Mayunmarca landslide of April 25, 1974, blocked the Mantaro River in Peru,
and the rising water level behind the landslide dam triggered landslides along
the shores of the lake (Lee and Duncan, 1975). Sudden breaching of the
Mayunmarca landslide dam and rapid drawdown of the lake level triggered
additional landslides along the banks of the lake (R.L. Schuster, 1992, U.S.
Geological Survey, personal commun.). Drainage of some glacial lakes in the
Finger Lakes region was believed to be quite rapid as evidenced by channels cut
into bedrock (Hand, 1978).
The Valley Heads recession began by 14,000 BP (Muller and Calkin, 1993). Landslides
triggered by rising or falling glacial lake levels in the study area are Late
Pleistocene in age, the youngest lakes in this area being gone by about 12,000
years BP (Fullerton, 1980). Consequently, the oldest landslides in the study area
probably date to a maximum of about 14,000 years BP, after the beginning of northward
retreat of the ice margin from the highest elevations in this region. Any older
Pleistocene landslide features would probably have been greatly modified or totally
removed by overriding ice. Landslides which occurred between about 10,000 and
14,000 yr BP have undergone subsequent slope modification under a presumably wet
and cold Late Pleistocene climate which distinguishes them geomorphically from
more recent Holocene landslides. These Late Pleistocene landslides are identified
as ancient landslides (Plate 1) and are unlikely to be fully reactivated because
the environmental conditions that led to their occurrence no longer exist. However,
under certain conditions, such as undercutting by streams or construction, or
by extreme climatic events, these ancient dormant landslides could be partially
or fully reactivated.
Based on the landslide inventory,
field observation and literature review we selected glacial clays, levels of
former glacial lakes, and degree of slope steepness as the most significant
independent or explanatory variables to use in a statistical procedure to model
landslide susceptibility. We used a logistic regression analysis to model
landslide susceptibility following the approach of Bernknopf et al. (1988),
Shu-Quiang and Unwin (1992) and Dikau and Jä„ger (1994). Logistic regression is
used to model the probability of a dichotomous variable, i.e. a dependent or
response variable with only two possible values. A logistic regression can be
compared with an ordinary least squares regression. The difference is that the
logit-transformation, or logit, of the dependent variable is used. The logit
transformation is calculated by log[p/(1-p)], p being the probability. In the
case of a dichotomous variable ordinary least squares regression is not
applicable because the requirement of constant variance of the error is not met
in the case of a binary variable (Bahrenberg et al., 1992). A logistic
regression eliminates this problem by using the logit transformation. The
analysis was performed on a tabulation of data that were digitized within a GIS,
in our case the Geographic Resources Analysis Support System (GRASS ). For the
statistical analysis and model derivation the Statistical Analysis System (SAS )
was used.
Landslide Inventory
An inventory of landslides within the Tully Valley study area
(Plate1) was prepared from photointerpretation of 360 black and white areal
photos taken in 1991 at a scale of 1:10,000. Some of the glacial landforms
in the area, such as hummocky till deposits, can be misinterpreted for slope-movement
deposits. Consequently, a field check of features interpreted as landslides
was necessary and carried out during a two-week period in late April and early
May of 1994. Each suspected landslide in the preliminary inventory was examined
in the field for diagnostic features, such as a main scarp, toe, etc. (Varnes,
1978), and either verified or rejected. Approximately 10% of the suspected
landslides were rejected in the field; another 10% additional landslides were
added to the inventory, mostly small active/recently-active landslides that
had occurred since the 1991 photos. A few small active/recently-active landslides
were discovered in the field within the map area of Plate 1. but slightly outside the boundary of photo coverage;
they are included on Plate 1, but are not utilized
in the statistical analyses. Despite heavy vegetative cover, several large
landslides that appeared questionable on the air photos were easily distinguishable
in the field.
Plate 1: Landslide inventory map, based on aerial photography and field
work. Landslide types are indicated by the following abbreviations: ef, earth
flow, es, earth slide, ds, debris slide, df, debris flow, bs, block slide,
mrs, multiple rotational slide, u, undefined. The study area represents the
area covered by aerial photographs. Landslides outside the study area were
not included for the susceptibility evaluation but are shown here for completeness.
The numbers in the corners are UTM eastings and northings.
(182 kb)
Based on field inspection the type and relative age of each landslide was
categorized. We chose three relative age classes: active/recently active,
old, and ancient. While there are no explicit rules for classification of
landslide age, the decisions can be based on the degree of modification of
typical landslide features (McCalpin, 1984; Wieczorek, 1984; Jibson and Keefer,
1988). No absolute dating, such as historical documentation, dendrochronology
or radiocarbon-age determination was available for calibration of landslide
age in this area. The chronological age of active/recently-active landslides
probably ranges from currently active during this season (zero years) to an
arbitrary age of about 200 years, approximately representing the period of
historical occupation in this area. The chronological ages of old (200-10,000
years) and ancient (10,000- 14,000 years) were selected to distinguish Holocene
from Late Pleistocene features.
The inventory includes 73 total landslides, of which 22% (16) were classified
as active/recently-active, 52% (38) fall in the category old, and 26% (19)
are termed ancient. The proportion of area covered by the different landslide
age groups differs significantly from the frequency (Table 1). Ancient landslides
covered the largest proportion of area, 227 hectares (562 acres), 170 hectares
(421 acres) are covered by old landslides and only 60 hectares (150 acres)
by recent/recently-active landslides. Old and ancient landslides (87% of the
combined landslide area) are more significant than active/recently-active
landslides (13% of landslide area) to the susceptibility model because the
statistical analyses are based on areal extent.
| Landslide Age Group |
Number |
% (Landslide area) |
| active/recently active |
16 |
13 |
| old |
38 |
37 |
| ancient |
19 |
50 |
Table 1: Distribution of landslide age by number
and percentage of total area involved in landsliding.
Digital Elevation Model (DEM)
U.S. Geological Survey Digital Elevation
Models (DEMs) of the eastern half of the Elmira 2ø sheet provided the topography
in the form of a regularly spaced 90-m array of elevation points. A 30-m spacing
available from DEMs of 7.5' quadrangles would have been preferable to use for
developing the susceptibility model, but was not available for the study area.
Soils
Soil information within Onondaga County was acquired from maps made at a
scale of 1:20,000 by the Soil Conservation Service of the United States Department
of Agriculture (USDA, 1977). Soil descriptions that accompanied these maps
identified those soil series which had a high clay content in the C-horizon
related to glacial lake deposits. Since this soil mapping only characterizes
the upper one to two meters (3-6 feet), deeper soils are not represented.
If clay underlies several meters of colluvium, as in the case of the Tully
Valley landslide, the clay would not be identified on the maps. Despite this
shortcoming, the maps were useful because they showed the minimum spatial
extent of clay deposits (Plate 4). The following clayey soil series were included:
Collamer Series, Lakemont Series, Niagara Series, Odessa Series, Rhinebek
Series, Shoharie Series and Williamson Series (USDA, 1977). In the development
of the susceptibility model the soil layer is treated as a single category,
i.e. a binary variable: (1) for glacial clays or (0) for any other soil.
Plate 4:
(42 kb)
Slope angle
Slope steepness is a major contributing factor to the occurrence
of landslides closely related to many other factors including the soil thickness,
climate, hydrology, lithology, structure and geomorphic history. Most assessments
of regional landslide hazard (potential, susceptibility, or probability) utilize
slope angle as one of several important independent variables (Brabb et al.,
1972; Carrara, 1983; Campbell and Bernknopf, 1993; Dikau and Jäger, 1994).
A categorization of slope steepness (0-5°; 6-10°; 11-15°; 16-25°; and >25°)
for the study area was determined using GRASS and displayed using ARC/INFO
in Plate 3.
Plate 3:
(81 kb)
In our statistical analyses slope steepness is not introduced as a slope angle
value but as a failure rate relative to particular selected slope categories.
Failure rate analysis (Aniya, 1985) compares the relative frequency of an
attribute within different population subsets. The failure rate is obtained
by dividing each relative frequency for a terrain factor such as slope angle
class for landslide and non-landslide cells (% area of slope class with landslides
/ % area of slope class without landslides). A value greater than 1 indicates
that the particular attribute contributes to landsliding. For example (Table
2), for the slope category of 11-15° there would be 1660 cells with landslides
for every 1000 cells without landslides (failure rate= 1.66).
We analyzed five slope classes (0-5°; 6-10°; 11-15°; 16-25°; and >25°)
for failure rate values for each separate age class of landslides and for
the combined data set of all landslides. Although the failure rate values
for each age category are given in Table 2, only the failure rate values for
the group of all landslides were used subsequently to calculate the susceptibility
model because the sample size of landslides in each individual age group was
too small to give statistically significant results. The two slope categories
6-10° and 11-15° each had failure rates significantly higher than one, indicating
that landslides are overly represented on these slopes. The failure rates
in Table 2 also suggest that ancient landslides tend to have occurred on steeper
slopes than old and recent landslides, possibly related to the presence of
glacial lakes.
| Slope angle category |
All landslides |
Active/recently active |
Old |
Ancient |
| 0-5° |
0.7 |
0.67 |
1.01 |
0.48 |
| 6-10° |
1.54 |
1.75 |
1.13 |
1.79 |
| 11-15° |
1.66 |
1.56 |
0.83 |
2.31 |
| 16-25° |
1.18 |
0.75 |
0.42 |
1.85 |
| > 25° |
0.0 |
0.0 |
0.0 |
0.0 |
Table 2: Failure rate values of slope categories
for different landslide age groups. No landslides occurred on slopes steeper
than 25 degrees.
The results in Table 2 also show that for the entire landslide sample within the
Tully Valley study area the steepest slopes are not necessarily the most prone
to landsliding and suggest other additional factors influence slope stability.
The accuracy of slope angles measured from a DEM depends
largely upon the spacing; in general, the closer the spacing, the better the
slope angles will reflect ground truth. The relatively large 90-m spacing of the
DEM available for the Tully Valley study area limits the accuracy of the
measured slope angles; as a result, slope values are averaged over large
distances and tend to be lower than would be measured in the field within any
given cell.
The model was calculated using the CATMOD
procedure of the SAS software package (SAS Institute Inc., 1989). CATMOD is a
procedure for modeling categorical data and can be used for logistic regression
models and log-linear models. The CATMOD software determined the parameter
estimates (Table 3) for the logistic regression model.
Table 3:
Parameter estimates used to calculate the probability for each cell to be
effected by landslides. FACTOR CLASS PARAMETER
(failure rate) ESTIMATE
Slope 0- 5° (0.7) 0.252
Category 6-10° (1.54) -0.611
11-16° (1.66) -0.693
16-25° (1.18) -0.149
>25° (0) 1.201
Soils 1 (clay) 0.435
Otisco-Cardiff 1 0.449
Lake
Heath Grove 1 0.285
Lake
First Lake 1 -0.075
Marietta
Intercept 4.2628
The parameter estimates were tested for their significance using the Chi-Square
test and were found to be significantly different from zero at a 99% confidence
level. The parameter estimates determined in the model included an intercept and
a value for each independent variable. The model took the form:
logit=b0+ bSOILS+ bOCL+ bHGL+ bFLM+ bSLOPEFR,
where b0=4.2628
and bi=parameter estimate. There are a limited number of possible combinations
(40) of the explanatory variables-soils, lake levels and slope categories. Using
the estimated parameters the logit was calculated for the possible combinations.
The probability for no landslide was then calculated by p=elogit/(1+elogit) for
each row in the contingency table (Table 4).
Table 4: Contingency table of probability values (PR0B) and susceptibility
categories (SUSCEPT) for each factor combination. OBS: consecutive observation
number, SOILS: soils layer, OCL: Otisco-Cardiff Lake, HGL: Lake Heath Grove, FLM:
First Lake Marietta, and SLOPEFR: slope failure rate.
OBS  SOILS OCL HGL FLM  SLOPEFR   PROB   SUSCEPT
 1     0    0   0   0       0   0.00141    low
 2     0    0   0   0     .70   0.00365    low
 3     0    0   0   0    1.18   0.00544    low
 4     0    0   0   0    1.54   0.00861    low
 5     0    0   0   0    1.66   0.00934    low
 6     0    1   0   0       0   0.00346    low
 7     0    1   0   0     .70   0.00891    low
 8     0    1   0   0    1.18   0.01325    low
 9     0    1   0   0    1.54   0.02086    moderate
10     0    1   0   0    1.66   0.02260    moderate
11     0    1   1   0       0   0.00611    low
12     0    1   1   0     .70   0.01564    low
13     0    1   1   0    1.18   0.02319    moderate
14     0    1   1   0    1.54   0.03630    moderate
15     0    1   1   0    1.66   0.03928    moderate
16     0    1   1   1       0   0.00527    low
17     0    1   1   1     .70   0.01351    low
18     0    1   1   1    1.18   0.02004    moderate
19     0    1   1   1    1.54   0.03144    moderate
20     0    1   1   1    1.66   0.03403    moderate
21     1    0   0   0       0   0.00337    low
22     1    0   0   0     .70   0.00867    low
23     1    0   0   0    1.18   0.01290    low
24     1    0   0   0    1.54   0.02031    moderate
25     1    1   0   0       0   0.00823    low
26     1    1   0   0     .70   0.02100    moderate
27     1    1   0   0    1.18   0.03105    moderate
28     1    1   0   0    1.54   0.04839    moderate
29     1    1   0   0    1.66   0.05231    high
30     1    1   1   0     .70   0.03655    moderate
31     1    1   1   0    1.18   0.05363    moderate
32     1    1   1   0    1.54   0.08250    high
33     1    1   1   0    1.66   0.08892    high
34     1    1   1   1     .70   0.03165    moderate
35     1    1   1   1    1.18   0.04655    moderate
36     1    1   1   1    1.54   0.07190    high
37     1    1   1   1    1.66   0.07757    high
Factor combinations not listed had a zero frequency (hence no probability value).
For example, (observation 34 in Table 4) for a cell of glacial clay below levels
of all three proglacial lakes within a slope category of 0-5°, the logit and probability
are calculated as follows:
logit= 4.2628 - 0.4350
- 0.4486 - 0.2850 + 0.0745 + 0.2520 = 3.4207
p (no landslide) = (e3.4207)/(1+e3.4207) = 0.9683
p (landslide) = 1 - 0.9683 = 0.0317
Note that the negative values of the parameter estimates are used for the soils
and lake levels, but not for the slope category which is a continuous independent
variable. Based on the probability values, the map (Plate 2) is categorized into three susceptibility classes
- low, moderate and high with numerical ranges of probability and respective
percentage of area indicated in Table 5.
Plate 2: Landslide susceptibility map based
on a logistic regression model. The model is based on a failure rate value for
slope steepness, the occurrence of glacial lake clays and three proglacial lake
levels (see Text).
(281 kb)
Table 5: Probability ranges, susceptibility
categories and extent of aerial coverage within each susceptibility category.
Probability Susceptibility  Study Area (%)
               category

  < 0.02        low              83.75
0.02-0.05     moderate           16.00
  > 0.05        high              0.25
A statistical model was developed
to represent the susceptibility to landsliding in a study area in part of
Onondaga County, New York. This model represents the spatial probability of
landslides, but gives no indication of temporal probability. The resulting map
shows the likelihood of being on landslide prone terrain due to landslides of
any age. The model represents landslide susceptibility in soils and on slopes
similar to the 1993 Tully Valley landslide. Slope steepness, soil type, and
previous glacial lake levels were accounted for in a logistic regression model.
A very small percentage of the study area (0.25%) falls within the 'high'
susceptibility category; however, in addition to the Tully Valley landslide,
small recently- active landslides in this area have resulted in property damage,
suggesting that landslides are an important hazard and potential risk. This
susceptibility map can be used for landslide hazard mitigation by identifying
landslide prone areas allowing for avoidance through zoning or other land use
policy decision or by engineering mitigation.
With the exception of the
Tully Valley landslide, active/recently- active landslides examined in the area
were relatively small. Large landslides, similar to the Tully Valley landslide,
were probably triggered by extreme hydrologic events. The majority of ancient
landslides are large and probably were triggered by rising or rapidly falling
proglacial lakes or by climatic extremes of high precipitation during the Late
Pleistocene. Human activity, such as slope modification in the form of cutting
slopes, have also resulted in small recently-active landslides in conjunction
with seasonal rainfall.
This landslide susceptibility map can be used as
a planning tool but is not recommended for individual site specific evaluations.
Areas within the moderate and high susceptibility categories should require
further study by engineering geologists before development to determine the
extent of possibly unstable conditions.
Andrews, D.E., and Jordan, R., 1978,
Late Pleistocene history of south-central Onondaga County: New York State
Geological Association, Guidebook 50th Annual Meeting, pp. 315-321.
Aniya, M., 1985, Landslide-susceptibility mapping in the Amahata River
basin, Japan: Annals of the Association of American Geographers, v. 75, n. 1, p.
102-114.
Bahrenberg, G., Giese, E., Nipper, J., 1992, Statistische
Methoden in der Geographie, Stuttgart, v.2, 415p.
Bernknopf, R.L.,
Campbell, R.H., Brookshire, D.S., and Shapiro, C.D., 1988, A probabilistic
approach to landslide mapping in Cincinnati, Ohio, with applications for
economic evaluation: Association of Engineering Geologists Bulletin, v. 25, n.
1, p. 39-56.
Blagbrough, J.W., 1951, The red clay deposits of Otisco
Valley. Masters Thesis, Syracuse University, 97p.
Brabb, E.E., Pampeyan.
E.H., and Bonilla, M.G., 1972, Landslide susceptibility in San Mateo County,
California: U.S. Geological Survey Miscellaneous Field Studies Map MF-360, scale
1:62,500.
Campbell, R.H. and Bernknopf, R.L., 1993, Time-dependent
landslide probability mapping: American Society of Civil Engineers, Proceedings
of the 1993 Conference, Hydraulic Engineering '93; July, 1993, San Francisco,
pp. 1902-1907.
Carrara, A., 1983, Multivariate models for landslide
hazard evaluation: Mathematical Geology, v. 15, no. 3, p. 403-426.
Dikau, R. and J„ger, S., 1994, Landslide hazard modelling in Germany and
New Mexico. In McGregor, D. and Thompson, D., ed., Geomorphology and Land
Management in a Changing Environment. Chichester (in press).
Dunn, J.R.,
and Banino. G.M., 1977, Problems with Lake Albany "clays", in Coates, D.R., ed.,
Landslides, Reviews in Engineering Geology, Geological Society of America, v.3,
p. 133-136.
Fairchild, H.L., 1898, Glacial Lakes Newberry, Warren and
Dana, in central New York: American Journal of Science, 4th Series, 7: pp.
249-263.
Fairchild, H.L., 1934a, Seneca Valley physiographic and glacial
history, Bulletin Geological Society of America, v. 45, pp. 1073-1110.
Fairchild, H.L., 1934b, Cayuga Valley Lake history: Bulletin Geological
Society of America, v. 45, pp. 233-280.
Fickies, R.H., 1993, A large
landslide in Tully Valley, Onondaga County, New York: Association of Engineering
Geologists News, v. 36, n. 4, pp. 22-24.
Fickies, R.H., and Brabb, E.E.,
1989, Landslide Inventory Map of New York: New York State Museum Circular, 52, 1
Map, scale 1:500,000.
Fleming, R.W., Johnson, A.M., and Hough, J.E.,
1981, Engineering geology of the Cincinnati area: Geological Society of America,
Annual Meeting, Field Trip Guide, n. 18., p. 543-570.
Grasso, T.X.,
1970, Proglacial Lake Sequence in the Tully Valley, Onondaga County: Field Trip
Guide Book, New York State Geological Association, 42nd annual meeting, p.
J1-J16
Hand, B.M., 1978, Syracuse meltwater channels: in Merriam, D.F.,
ed., New York State Geological Association Guidebook, 50th Annual Meeting, 23-24
September, 1978, p. 286-314.
Jibson, R.W., and Keefer, D.K., 1988,
Landslides triggered by earthquakes in the central Mississippi Valley, Tennessee
and Kentucky: in Russ, D.P., and Crone, A.J., eds., The New Madrid, Missouri,
earthquake region-geological, seismological, and geotechnical studies, U.S.
Geological Survey Professional Paper 1336-C, 24 p.
Jones, F.O., Embody,
D.R., and Peterson, W.L., 1961, Landslides along the Columbia River Valley
northeastern Washington: U.S. Geological Survey Professional Paper 367, 98 pp.
Karlsrud, K., Aas, G., and Gregersen, O., 1984, Can we predict landslide
hazards in soft sensitive clays? Summary of Norwegian practice and experiences:
Fourth International Symposium on Landslides, Toronto, v. 1. p. 107-130.
Lambe, T.W., and Whitman, R.V., 1969, Soil Mechanics: John Wiley &
Sons, Inc., New York, 553p.
Lane, K.S. 1967, Stability of reservoir
slopes: In Fairhurst, C., ed., Failure and Breakage of Rock, Proceedings, of the
8th Symposium on Rock Mechanics, American Institute of Mining, Metallurgy and
Petroleum Engineering, New York, pp. 321-336.
Lee, K.L., and Duncan,
J.M., 1975, Landslide of April 25, 1974 on the Mantaro River, Peru: National
Academy of Sciences, Washington, D.C., 72 pp.
McCalpin, James, 1984,
Preliminary age classification of landslides for inventory mapping: 21st Annual
Symposium on Engineering Geology and Soils Engineering, April 5-6, 1984,
Pocatello, Idaho, 13p.
Newland, D.H., 1909, A peculiar landslip in the
Hudson River clays: New York State Museum Bulletin 133, pp. 156-158.
Newland, D.H., 1916, Landslides in unconsolidated sediment, with a
description of some occurrences in the Hudson Valley: New York State Museum
Bulletin, 187, pp. 79-105.
Ohlmacher, G.C., and Baskerville, C.A., 1991,
Landslides on fluidlike zones in the deposits of glacial Lake Hitchcock, Windsor
County, Vermont : Association of Engineering Geologists Bulletin, v. 28, n. 1,
p. 31-44.
Robak, T.J., and Fickies, R.H., 1983, Landslide susceptibility
within the lake clays of the Hudson Valley, New York: New York State Geological
Survey Open-File Report 504.024 (2 sheets).
SAS Institute Inc., 1989,
SAS/STAT User's Guide, Version 6, Fourth Edition, Volume 1, Cary, NC: SAS
Institute Inc., 943p.
Schuster, R.L. 1979, Reservoir-induced landslides:
Bulletin of the International Association of Engineering Geology, v. 20, pp.
8-15.
Shu-Quiang, W., and Unwin, D.J., 1992, Modelling landslide
distribution on loess soils in China: an investigation: International Journal of
Geographic Information Systems, v. 6, pp. 391-405.
Skempton, A.W., 1964,
Long term stability of clay slopes: Geotechnique, v. 14, n. 2, p. 77- 102.
Tavenas, F., 1984, Landslides in Canadian sensitive clays-a
state-of-the-art: Fourth Symposium on Landslides, Toronto, v. 1, p. 141-153.
USDA, 1977, Soil Survey of Onondaga County, New York: Soil Conservation
Service, 235 p.
Varnes, D.J., 1978, Slope movement types and processes,
In Landslides Analysis and Control, Schuster. R.L., and Krizek R.J., eds.,
Transportation Research Board, Special Report 176, National Academy of Science,
Washington, D.C., pp. 12-33.
Von Engeln, O.D., 1928, Interglacial
deposits in central New York: Bulletin Geological Society of America, 40: pp.
459-480.
Wieczorek, G.F., 1984, Preparing a detailed landslide-inventory
map for hazard evaluation and reduction: Association of Engineering Geologists
Bulletin, v. 21, no. 3, p. 337- 342
Go back to the beginning of the document,
Stefan Jäger
Dept. of Geography,
University of Heidelberg
Im
Neuenheimer Feld 348
69120 Heidelberg, Germany
stefan@geo0.geog.uni-heidelberg.de
Gerald F. Wieczorek
US Geological Survey,
922 National Center
Reston, VA 20192
gwieczor@resdgs2.er.usgs.gov