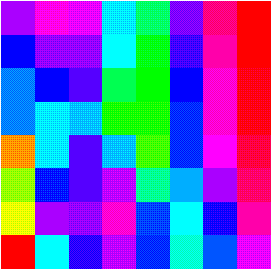
A picture of the elevation of Central California for 32-km cells mapped to hue in Mathematica, a program we use below to manipulate, analyze, and visualize data. Here, the visualization is used to demonstrate some of the multilevel ideas suggested by the definition of mosaic.