
PRELIMINARY EVALUATION OF THE FIRE-RELATED DEBRIS FLOWS ON STORM KING MOUNTAIN, GLENWOOD SPRINGS, COLORADO
THE POST-FIRE, PRE-DEBRIS FLOW SETTING
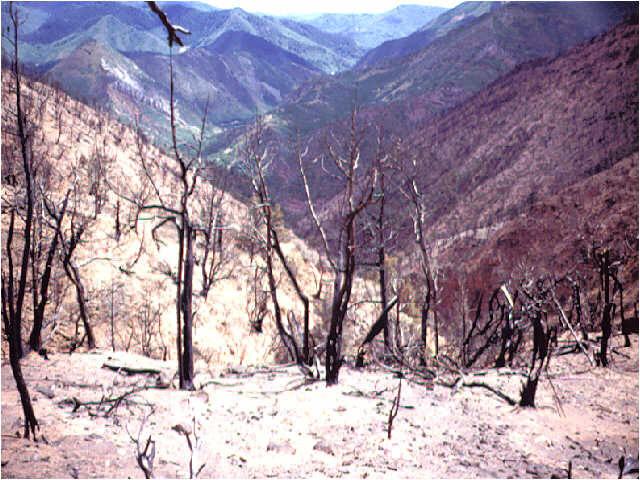
The South Canyon fire burned approximately 2000 acres of pinyon-juniper and mountain shrub vegetative communities
(Plate 1 and Figure 2). The most intensely burned area extends
from roughly 0.5 mile up the mountain side to near the summit of the mountain, and is characterized by the complete
burning of large branches and many major tree trunks, completely burned brush and grass, and the presence of both
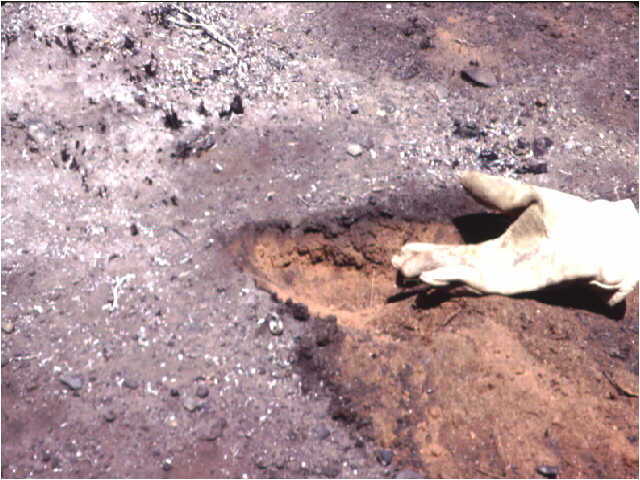
dark and white ash (Figure 4). Some sandstone outcrops were fractured by the intense
thermal stresses. The burnt soil is loose and friable, and approximately 2 to 4 inches in depth (Figure
5). Two samples of burnt soil (taken from the same location but at depths of 0-1 inch and 1-4 inches) were
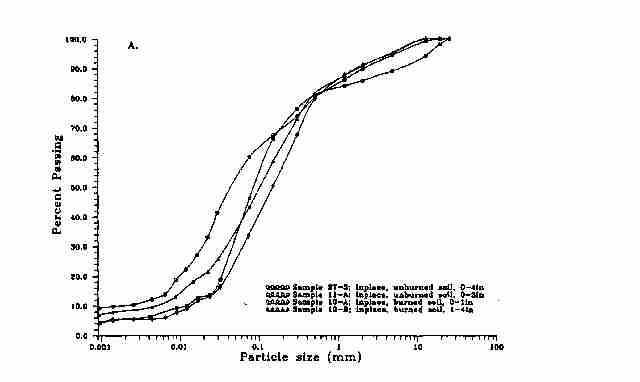
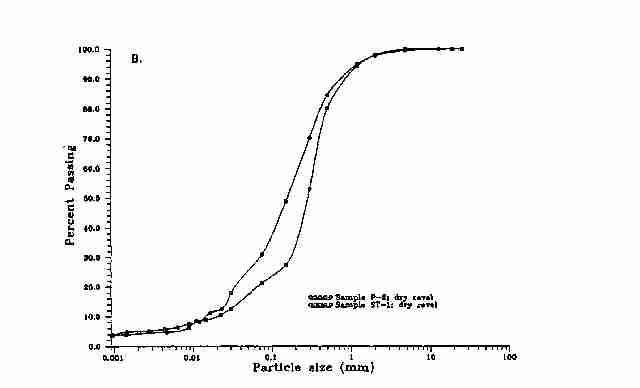
classified as silty sand (Table 1). The grain-size distribution of the burned soil is essentially
the same as that for unburned soil (Figure 3A), indicating no discernable alteration
in grain-size distribution occurs with burning. The average dry density of three samples of burned soil is 0.026
lb/in³. Around the margins of the heat of the fire was less intense; within this zone some leaves are left
on trees, branches are only partially burned, and scattered clumps of grass with some short stubble remain. Approximately
0.25 to 1.0 inch of charcoal on top of 0.5 to 1.5 inches of loose, friable, burned soil are present. The development
of a few-centimeter thick water-repellant layer in the soil formed by the condensation of hydrophobic organic compounds
upon burning and vaporization of vegetation and litter is often described as the result of a fire, and can effect
the erosion potential of a site by increasing surface runoff (Wells, 1987). Hydrophobic soils were observed in
the burned area and obvious hydrophobic characteristics were observed to a depth of five inches in laboratory samples
of burned soil; water stood on the samples for at least four hours before sinking in. Note however, that other
researchers have stated that such a layer can, in fact, be more common in unburned sites than burned, and thus
a water-repellant layer is not necessary for the development of a major surface runoff event following a fire (e.g.
Meyer, 1993). In the days following the fire, residents of Glenwood Springs reported seeing huge clouds of white
dust flying above the mountain; presumably the loose, friable and virtually unprotected burned mineral soil and
ash on the hillsides were being transported by wind and deposited in the side drainages. The processes of dry ravel
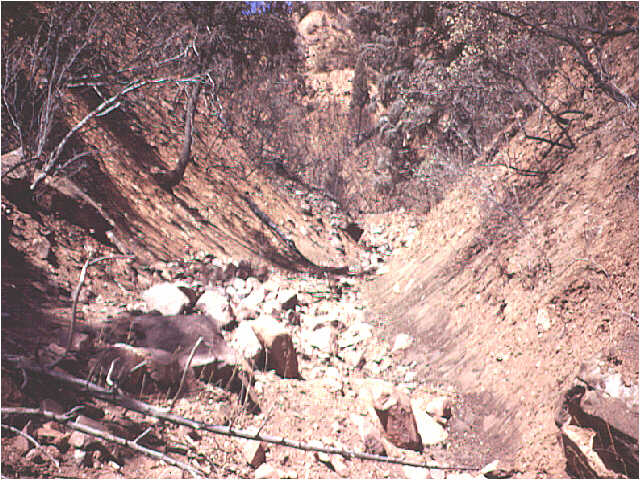
also resulted in the downslope transport of material. Accumulations of loose, silty sand material and ash up to
3 ft deep along the sides of most side drainages were observed (Figures 6 and 7,
Table 1). This material is well sorted, and is devoid of the >0.5mm fraction seen in the
in place soils (Figures 3A, B). A void ratio of approximately
0.33 was obtained for a sample of this material by determining the amount of water added to a known volume of material
at saturation. Aprons of this loose material were also observed on many side slopes (Figure
8). Further, larger material in the form of loose boulders, cobbles and channel alluvium has been deposited
in the channel over the years by either gravity-driven or stream and debris-flow processes (Figure
7). The material in the channel was available for entrainment by channel runoff during the storm, and the material
on the side slopes was susceptible to erosion and transport by surface flow.
SEPTEMBER, 1994 EVENT
On the night of September 1, 1994 at approximately 10:30 pm, in response to a torrential downpour, a wall of mud,
rocks and burned trees came crashing down onto Interstate I-70 in four places. Thirty cars traveling on the highway
at the time were engulfed by the mud, but luckily only minor injuries were reported. According to Colorado Department
of Transportation personnel, material continued to flow out of the canyons throughout the night of September 1
and the early morning hours of September 2. Mud and debris issuing from the mouth of drainage B overtopped the
Jersey barriers that divide the west- and east-bound lanes of the interstate and continued into the Colorado River,
where it was deposited as a fan that blocked nearly half of the river (Plate 1, Figure 9).
Material from drainage B also traveled westward along I-70, again overtopping the Jersey barriers into the east-bound
lanes, and finally stopped at mouth of drainage A (Figures 10 and 11,
Plate 1). The coarsest material in the flow was deposited at the mouth of the canyon,
while the more fluid material continued over the interstate (Figure 12). Sample ST-2,
collected from a terrace surface near the canyon mouth, was classified as a silty sand (Table 1) and its grain-size
distribution is shown in Figure 3C. Sample GS-19A, collected from the fan deposited
at the mouth of the canyon, shows a considerably greater coarse fraction, and is classified as a silty, sandy gravel
(Table 1, Figure 3C). Material from drainage C traveled down the
I-70 access ramps, under the overpass, and continued to the Colorado River (Plate 1,
Figure 13). The access roads were buried by up to 5 feet of mud, boulders, and debris,
with an average depth 2 feet. An average density of 0.055lb/in³ (1.53 times higher than that of water at 0.036lb/in³),
and a water content of 53% by weight was determined for these materials by Brain Menounos of the University of
Colorado from samples taken on September 4, 1994 beneath the overpass. Material collected from the fan deposited
at the canyon mouth (Sample GS-17) is classified as a silty sand (Table 1); the gradation
curve for the sample is shown in Figure 3C. Sample USGS-12 was taken at the head of a slight draw on the canyon
sidewall of drainage C, as the first appearance of debris-flow deposits, and is also classified as a silty sand,
and its particle-size curve differs from that of sample GS-17 in that it has slightly more fine materials (Figure
3C). Material issuing from the mouth of drainages F and G also covered the interstate
with layer of mud and debris from a few inches thick to 0.5-feet thick. Deposition of material also occurred at
the bases of the two watershed fronts (H and I, Plate 1). Figure 14
shows that material that was deposited in the west-bound lane and along the interstate at the base of watershed
front I. Interstate I-70 was closed until 3 pm September 2 when one lane in each direction was opened. Approximately
14,900 vehicles use I-70 on a typical day. Material was deposited at the mouths of every major drainage whose upper
reaches were burned (Plate 1). Calculations of the areas inundated by the flow events
are tabulated in Table 3, along with the approximate volume of material deposited at the canyon mouths, calculated
by assuming an average depth for each deposit. A total area of approximately 35 acres was inundated.
Table 3. Area inundated, average depth, and volume of material deposited at each canyon mouth.
|
Drainage
|
Deposit
Area (acres)
|
Average
Depth (ft)
|
Deposit Volume
(yds³)
|
|
B
|
8.5
|
2.0
|
27,400
|
|
C,D
|
15.9
|
2.0
|
51,400
|
|
E
|
1.1
|
1.0
|
1,800
|
|
F
|
5.8
|
0.6
|
5,600
|
|
G
|
1.7
|
0.5
|
1,400
|
|
H
|
1.1
|
1.0
|
1,800
|
|
I
|
1.1
|
1.0
|
1,800
|
|
TOTAL
|
-----
|
-----
|
91,300 yds³
|
The estimated volumes of deposits are conservative in that an average depth of deposits over the road and ground
surface was used; the depth of material deposited in the basins at the mouths of the canyons is not taken into
account.
Rainfall Conditions
Unfortunately, only daily rainfall totals recorded at a site approximately 2 miles from Storm King Mountain are
available; the rainfall total for Friday, September 2 of 0.67 inches was recorded at the corner of 13th and Grand
Avenues in Glenwood Springs. Eyewitness accounts suggest that rainfall conditions on the west end of Glenwood Springs
(and closer to Storm King Mountain) were more severe than are indicated by this total. A motorist described the
rain as "...so hard you almost couldn't see. It came down like a monsoon". The first and strongest pulse
of intense rainfall was reported to have occurred between 8 and 9 pm, another pulse of intense rainfall occurred
at 10:30, and rain was still falling heavily at 11pm. The recurrence interval for the 24-hour rainfall total reported
for this storm is not long, indicating that the 24-total was not an unusual event (N. Doeskin, State Climatologist,
personal communication, 1995). Observations that this amount of rainfall fell in a very short time period, however,
would suggest a less frequent recurrence of short duration, intense rainfall. The lack of detail of the recording
station, or site-specific data for Storm King Mountain, precludes this determination, however.
The Mobilization of Sediment from Burned Basins
Principal mechanisms for the mobilization of sediment from Storm King Mountain include particle-scale, grain-by-grain
failure of surficial material leading to the formation of rills and gullies, the entrainment of the loose, dry
ravel material in the side channels and colluvium and alluvium in the main channels by surface runoff. These processes
in the burned basins caused sediment concentrations to progressively increase and produced debris-flow conditions.
Wells (1987) suggests that saturation of a thin layer of surficial soil during an intense rainfall event may result
in the formation of either small-scale granular or debris flows. Continued and sequential small-scale failures
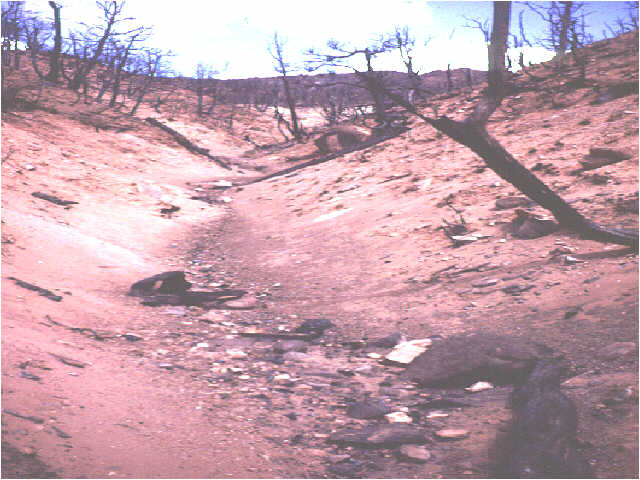
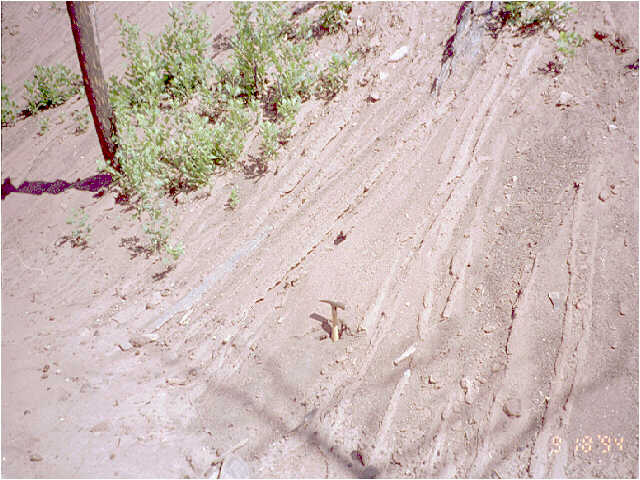
lead to the formation and of rills and gullies. On Storm King Mountain, the formation of rills and gullies was
observed in both the inplace, burned mineral soil and in the aprons of dry ravel material on the side slopes leading
to drainages (Figure 15). Rills started up high on the slopes and their relative density,
depth, and width increased with distance down slope. Formation of rills and gullies served to contribute loose
mineral soil from the hillsides into the channels, as well as to provide efficient transportation routes for surface
runoff. This is a self-perpetuating process; as the flow volume increases, more material is entrained, and the
rills and gullies deepen and widen. Field estimates made following the September events suggest that during the
September storm on Storm King Mountain, approximately 15% of the burned mineral soil was removed to an approximate
average depth of 1.5 inches by rill and gully formation. Note that the degree of rill and gully formation on Storm
King Mountain is considerably less than that observed in burned watersheds in Yellowstone National Park (Meyer,
1993), and near San Luis Obispo, California (S. Ellen, U.S. Geological Survey, personal communication, 1994). The
more predominant sediment-transporting mechanism acting on Storm King Mountain was progressive sediment bulking
of the surface runoff. The abundant loose, friable material blown and transported into the side channels by wind
and dry ravel in the days following the fire was incorporated into the surface flow as it progressed downchannel.
In addition, the material deposited and stored in the stream channels from years of smaller flooding and debris-flow
events was incorporated into the flows. Detailed observations high on the hillside in drainage C indicated that
at a point 300 ft below the ridgecrest, sufficient loose material had been entrained by the surface flow to give
debris-flow qualities to the deposits. The widespread occurrence of the process of debris avalanche as sources
for debris flow, described previously, is precluded by the observation of the lack of numerous or widespread scarps
or depressions at the head of drainages that experienced flow events on Storm King Mountain. A few landslide scarps
are noted on Plate 1, but most of these contributed little volume of material to the prevalent process. The lack
of debris avalanche scars observed in the burned area of Storm King Mountain is in keeping with the general observation
that debris avalanches are less likely to occur in burned areas than in unburned ones. For example, Morton (1989)
mapped eight times the number of debris flows on unburned slopes than occurred on burned slopes in the San Timoteo
Badlands of southern California. This phenomenon is explained by increased surface runoff following a fire, so
that failure triggered by infiltration is reduced. The net result of the September rainstorm was to flush most
of the dry-ravel deposits from the side channels, transport the loose, larger material from the main channels,
and precipitate the erosion of loose surficial soil from the hillsides.
Flow Dynamics
In general, the flows show an interesting combination of both debris- and hyperconcentrated-flow processes. As
the flows traveled down the canyons, and particularly at the mouths of the canyons where material cascaded over
high sandstone cliffs, they can be considered as hyperconcentrated. Figure 16 shows
the deposits left by the passage of a flow through drainage C. At the margins of the flow path, the material deposited
was very thin, indicating a high water content. In addition, as shown in Figure 17,
the loose, friable mineral soil and ash that the flow traveled over was not disturbed, indicating the low strength
of the flowing material. Within the channel, deposits of large boulders in a muddy matrix indicated a much stronger
slurry that would approach the debris-flow behavior end of the sediment-water flow continuum (Figure 18).
A cross-section through the flowing material would thus show a downward gradation from a very fluid, low strength
slurry at the top, to a much higher strength slurry at the base. This gradation (representing a non-single phase
fluid) is shown by the particle-size distribution for the slurry materials in Figure 3C,
and is a diagnostic feature of hyperconcentrated flow. The deposits at the mouths of the canyons also show characteristics
typical of hyperconcentrated flows. Figure 19 is a photograph of a cut made into the
deposits at the base of drainage C and shows an approximately 1-foot thick layer of well-sorted, fine-grained material
that grades downward into clast-supported, gravel- and boulder-size material at the base, another characteristic
of hyperconcentrated flow. In this setting, most of the coarser-grained material settled out of suspension, and
the interstitial fluid, consisting primarily of fine-grained silts and clays held in suspension, then continued
to travel over the interstate and into the Colorado River as a single-phase, but low strength, hyperconcentrated
flow. Approximate velocities of the flows in drainages B, C, and F at the locations of the transects shown on Plate 1 were calculated using a technique proposed by Johnson, (1984). This technique is
based on the observation that lateral deposits are commonly higher on the outsides of bends than on the insides.
In this approach the velocity of the flow is calculated as a function of the degree of runup around a curve b,
the channel gradient l, and the radius of curvature of the path R, where
 This approach is based on the assumption that the material in the flow behaves as a perfect fluid, and is thus
a reasonable approximation for the low-strength phase of the Storm King Mountain flows. Approximate calculated
velocities, the cross-sectional area of the flow at that location, and the calculated peak discharge are tabulated
in Table 4. Note that the discharge calculated must be considered as the peak because the upper-most margins of
the deposits (used in calculating cross-section areas) are those left during peak flows. Work by Rowe et al., (1954)
indicated that peak discharge was the best indicator of watershed performance and was particularly sensitive to
fire effects.
This approach is based on the assumption that the material in the flow behaves as a perfect fluid, and is thus
a reasonable approximation for the low-strength phase of the Storm King Mountain flows. Approximate calculated
velocities, the cross-sectional area of the flow at that location, and the calculated peak discharge are tabulated
in Table 4. Note that the discharge calculated must be considered as the peak because the upper-most margins of
the deposits (used in calculating cross-section areas) are those left during peak flows. Work by Rowe et al., (1954)
indicated that peak discharge was the best indicator of watershed performance and was particularly sensitive to
fire effects.
Table 4. Calculated velocities, cross-sectional areas, and peak discharges of the flows for given drainages.
|
Transect
|
Drainage
|
Velocity
(ft/sec)
|
Area
(ft²)
|
Discharge
(ft³/sec)
|
|
1
|
B
|
22
|
187
|
4000
|
|
2
|
B
|
10
|
110
|
1000
|
|
3
|
B
|
15
|
189
|
2810
|
|
4
|
B
|
19
|
---
|
---
|
|
5
|
C
|
28
|
92
|
2600
|
|
6
|
C
|
10
|
110
|
1100
|
|
7
|
C
|
19
|
78
|
1500
|
|
8
|
F
|
20
|
---
|
---
|
Note that the values for Transects 6 and 7 were supplied by Brian Menounos, University of Colorado. Although the
velocities and discharges given in Table 4 are only approximate, the range of velocities reported is within the
range of those reported by Mears (1977) for debris flows triggered by intense rainstorms in Glenwood Springs. The
range of discharges reported here is nearly twice those reported by Mears (1977), perhaps due to the fact that
these were fire-related events, with substantially more material available for incorporation into the flows. In
addition, the difference of 3000 ft³/sec calculated between transects 1 and 2 in drainage B occurs over a
distance of only 200 ft; the only explanation for this difference being the degree of accuracy in determining the
variables used in calculating the velocity. These values thus must be viewed as approximate ranges.