IF CLICKING ABOVE DOES NOT WORK, CLICK THE BACK BUTTON ON THE BROWSER
(JAVASCRIPT MAY BE DISABLED)
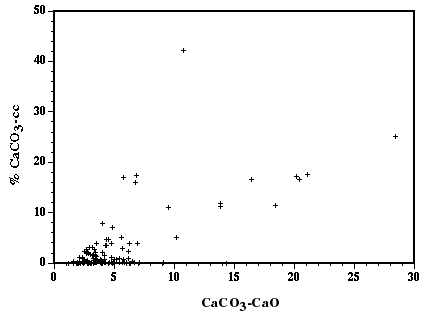
Figure 6.
Figure 6.
Scatter plot of Percent CaCO
3
calculated from total calcium(-Ca) and carbonate (-CC) in samples of sediment from Tule Lake, California.
IF CLICKING ABOVE DOES NOT WORK, CLICK THE BACK BUTTON ON THE BROWSER
(JAVASCRIPT MAY BE DISABLED)