
NOTE: Actual Map Size is 34x34 Inches and Includes Detailed Roads.
This map identifies the principal areas in the San Francisco Bay region that are likely to produce debris flows, which are also called "mudslides." Debris flows that occur in the bay region are fast-moving downslope flows of mud that may include rocks, vegetation, and other debris. These flows begin during intense rainfall as shallow landslides on steep slopes. The rapid movement and sudden arrival of debris flows pose a hazard to life and property during and immediately following the triggering rainfall.
Debris flows in a given storm originate from a number of sources scattered throughout steep parts of the landscape (figure 1). During subsequent storms, new debris flows originate from different sources. These various sources, however, are similar in topographic form because debris-flow initiation requires steep slopes and prefers concave parts of hillsides. These topographic characteristics are used to predict the likely future source areas shown on this map.
MAP UNITS
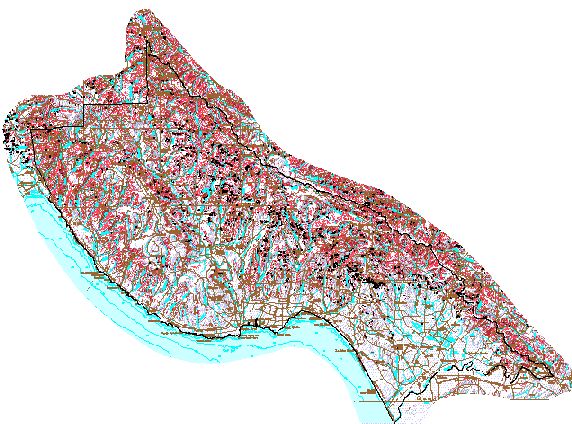
The red zones of the map portray the
principal areas from which debris flows can be expected during future
storms. The black dots represent the debris-flow sources mapped
after the catastrophic storm of January 1982. The dots provide an
example of the abundance of debris flows that might be expected
during a major rainstorm, and they illustrate the approximate nature
of this predictive map.
HAZARD
Because debris flows travel downslope
and downstream from source areas, hazards commonly extend beyond the
red zones of the map. In the vicinity of the red zones, common areas
of hazard are 1) near the base of steep hillsides, 2) near the mouths
of steep sidehill drainages, and 3) in and near the mouths of canyons
that drain steep terrain. Examples of these hazardous settings are
shown in figure 1.
USE OF THE MAP
The map shows the principal source
areas of debris flows from natural hillslopes in the region. Debris
flows and other fast-moving landslides may also occur from man-made
slopes, such as the cut slopes along highways in hilly terrain, but
such sources generally are not shown on the map. Debris flows also
are possible from unmodified steep areas outside of the red zones,
but we expect that most debris flows will originate in or near the
red zones of the map.
Because the map depicts source areas
and not flow paths, and because of its broad areal coverage and small
scale, the map is intended to be used as a guide to general areas of
debris-flow hazard rather than as a predictor of hazard at specific
sites. Appropriate uses include storm-preparedness planning for
emergency access and response.
 Principal predicted debris-flow
source areas
Principal predicted debris-flow
source areas
 Approximate source areas of
debris flows triggered
Approximate source areas of
debris flows triggered
during
the storm of January 1982
PREPARATION OF THE MAP
The map was produced using a Geographic
Information System (GIS) from a 30-meter-square grid of topographic
elevations in the region. The grid of elevations, called a digital
elevation model (DEM), permits calculation of hillslope steepness and
curvature for each 30-m cell. The potential debris-flow sources
shown on the map were determined using the values of steepness and
curvature defined in table 1. Mapped sources of historical debris
flows in calibration areas were used to determine the parameters in
table 1; the calibration areas we used are near Montara Mountain in
San Mateo County (Wentworth, 1986) and in part of Marin County (plate
6 of Ellen and others, 1988). In these meticulously mapped
calibration areas, the red zones include 82 percent of the mapped
debris-flow sources. In the bay region as a whole, only 53 percent
of the black dots of the map lie within the red zones. This low
percentage probably results at least in part from inaccurate location
of the black dots, because small-scale base maps were used to plot
some of the locations during region-wide
mapping.
Table 1: Hillslope steepness and curvature used to map potential
debris-flow source areas [Values as measured on 30-m elevation grids.
Plan curvature is curvature of the ground surface in a horizontal
plane; it is measured as 1/r, where r is radius of curvature in
meters and negative values indicate concave areas such as swales]
Hillslope steepness Plan curvature
20 degrees and greater +0.01 and less
REFERENCES CITED
Ellen, S.D., Cannon, S.H., and Reneau, S.L., 1988, Distribution of
debris flows in Marin County, plate 6, in Ellen, S.D., and Wieczorek,
G.F., eds., Landslides, floods, and marine effects of the storm of
January 3-5, 1982, in the San Francisco Bay region, California: U.S.
Geological Survey Professional Paper 1434, 310 p., plate 6 at
1:24,000 scale.
Wentworth, C.M., 1986, Maps of debris flow features evident after the
storms of December 1955 and January 1982, Montara Mountain area,
California: U.S. Geological Survey Open-File Map 86-363, 2 sheets at
1:24,000 scale.


 Return to
WRGIS Home Page
Return to
WRGIS Home Page