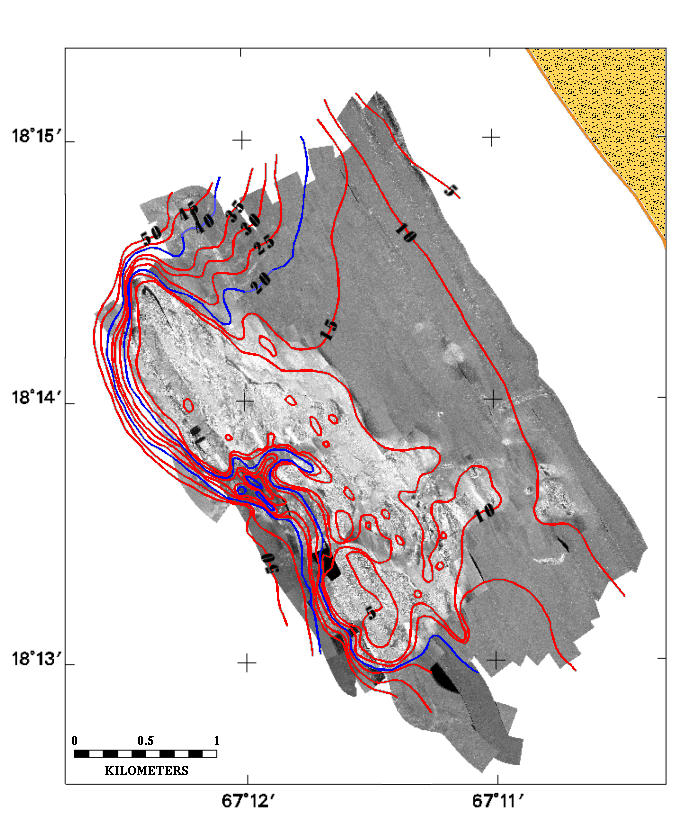
Figure 4. Map showing the bathymetry of the study area as derived from analysis of the 3.5 kHz profiles. Contours are in meters.
Return to document.