Lawrence J. Poppe1, Ralph S. Lewis2,
Roman N. Zajac3,
David C. Twichell1, Eric A. Schmuck1, Kenneth F. Parolski1,
and Mary L. DiGiacomo-Cohen2
1
U.S. Geological Survey, Woods Hole, MA 02543Ongoing research by the U.S. Geological Survey (USGS) in Long Island Sound, a major East Coast estuary surrounded by the most densely populated region of the United States, is building upon cooperative research with the State of Connecticut that was initiated in 1982. During the initial phase of this cooperative program, geologic framework studies in Long Island Sound were completed and results published (Lewis and Needell, 1987; Needell and others, 1987; Lewis and Stone, 1991). Emphasis of the present program in Long Island Sound is shifting from framework studies toward studies of the sediment distribution, processes that control this sediment distribution, nearshore environmental concerns, and the relation of benthic community structures to the sea-floor geology.
Because of the enormous surrounding population, large inputs of anthropogenic wastes (e.g., fertilizer and sewage) and toxic chemicals have produced stresses on the environment of the Sound, causing degradation and potential loss of benthic habitats (Long Island Sound Study, 1994). To examine this environmental problem, we are constructing sidescan sonar mosaics (complete-coverage acoustic images) of the sea floor within specific areas of special interest, such as in areas affected by seasonal hypoxia like the Norwalk Islands survey or near major coastal resources like the Hammonasset Beach survey (fig. 1). The mosaic that we have constructed off Hammonasset Beach State Park and which is presented herein: (1) allows insight into the geological variability of the sea floor, which is one of the primary controls of benthic habitat diversity; (2) provides a detailed framework for future research, monitoring, and management activities; and (3) improves our understanding of the complex processes that control the distribution of bottom sediments, benthic habitats, and associated infaunal community structures off one of the most important coastal recreational facilities within the State of Connecticut. Because precise information on environmental setting is important to the selection of sampling sites and to the accurate interpretation of point measurements, the sidescan sonar mosaics also act as base maps for subsequent sedimentological, geochemical, and infaunal sampling and bottom photography.
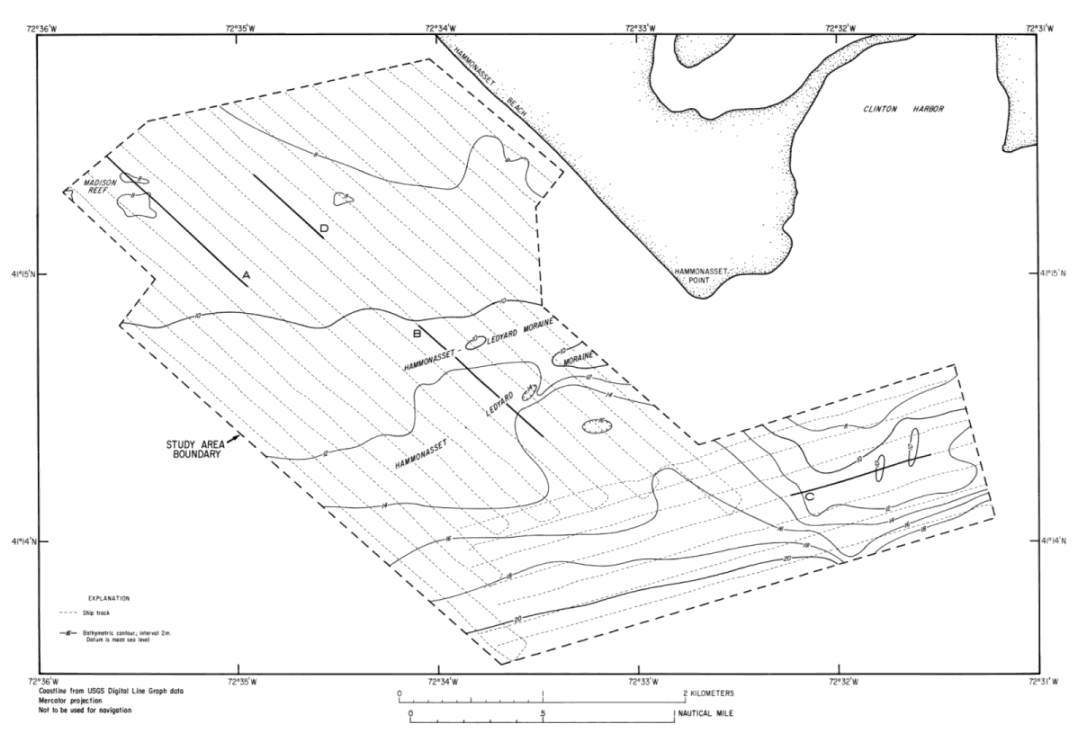
Long Island Sound occupies an elongate east-west basin that is about 182 km long by a maximum of 32 km wide (Lewis and Stone, 1991). It is bordered on the north by the rocky shoreline of Connecticut and on the south by the eroding sandy bluffs of Long Island, N.Y. The study area (figs. 1 and 2), which covers about 12.7 km2, lies in northeastern Long Island Sound offshore from two major recreational facilities, Hammonasset Beach State Park and Clinton Harbor.
The bedrock beneath the study area is believed to be composed of gneissic metamorphic rocks of pre-Mesozoic age (Lundgren and Thurrell, 1973; Rodgers, 1985). The bedrock is unconformably overlain by two tills, one of pre-Wisconsinan age and one of late Wisconsinan age (Flint, 1971). Glacial lake deposits, stratified drift, and Holocene marine sediments variously overlie the bedrock and till (Lewis and Stone, 1991). The northward retreat of the late Wisconsinan ice sheet is marked in southeastern Connecticut by a series of minor recessional moraines (the Hammonasset-Ledyard, Old Saybrook, and Mystic Moraines; see fig. 1) and associated outwash deposits (Goldsmith, 1980). These moraines, prominently represented within the study area by the Hammonasset-Ledyard Moraine (Stone and others, 1992; J.R. Stone and J.P. Schafer, USGS, unpub. data, 1994), are relatively linear, discontinuous, usually capped by boulders, and commonly aligned as double ridges that parallel the major recessional Harbor Hill - Roanoke Point - Charlestown Moraine and Ronkonkoma Moraine complexes on Long Island. West-southwestward from Hammonasset Point, the Hammonasset-Ledyard Moraine extends offshore and appears to correlate with a submerged moraine and lacustrine fan complex south of New Haven to the west, and with the Ledyard Moraine to the northeast beyond the area of figure 1 (Goldsmith, 1980; J.R. Stone and J.P. Schafer, USGS, unpub. data, 1994).
Strong tidal currents have extensively eroded and reworked both the glacial and postglacial deposits and continue to influence sedimentary processes and surficial sediment distributions in eastern Long Island Sound. The irregular bottom topography and extensive lag deposits of the eastern Sound reflect scour, transport, and reworking of the sediments (Lewis and Stone, 1991).
DATA COLLECTION AND PROCESSING
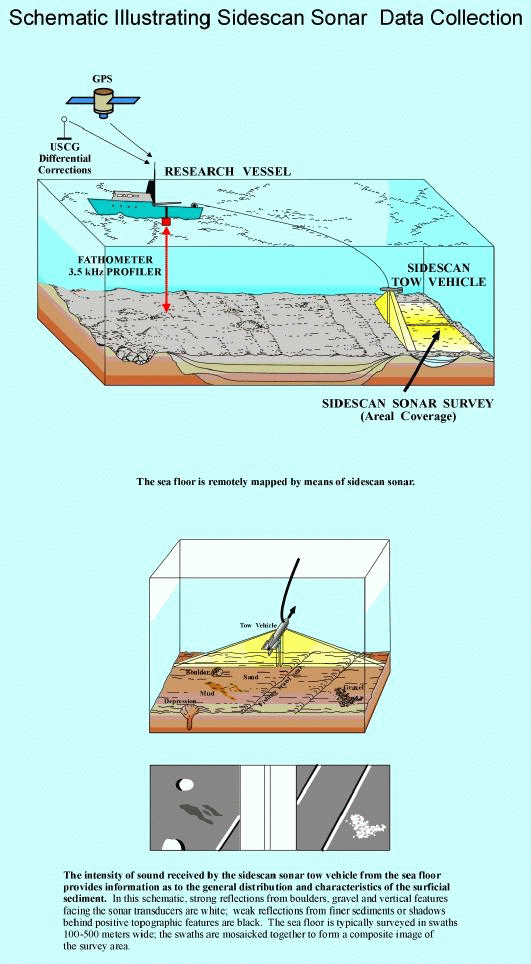
Sidescan sonar imagery, bathymetry, 3.5-kHz subbottom profiles, and navigational data were collected along tracks spaced 150 m apart aboard the RV Asterias during June 11-15, 1994 (figs. 2, 3, and 6). The bathymetric data were collected by means of a 200-kHz echo sounder, and the data were logged digitally to a computer. The subbottom data were collected in analog form using an Ocean Research Equipment 3.5-kHz profiler transmitting at a 0.25-s repetition rate. The sidescan sonar data were collected using a 100-kHz Klein sidescan sonar system set to sweep 100 m to either side of the ship=s track. These data were logged digitally to 8-mm tape on a QMIPS data acquisition system (Danforth and others, 1991). Ship position was determined with a differential Global Positioning System (GPS); navigational data were logged on a computer at 10-s intervals. The bathymetric data were corrected for the approximately 1.4-m tidal range in the study area. These data were corrected by adjusting the measured depth values to the predicted mean sea level for Madison, Conn., approximately 2 km northwest of the study area. The Madison values were calculated from actual tidal-height measurements performed at Bridgeport, Conn.
The sidescan sonar data were processed according to procedures summarized by Danforth and others (1991). Briefly, the sonar data were multiplexed and filtered to convert them into a format usable by the processing routines and to remove speckle noise. The data were corrected for slant-range distortions, striped noise was removed, and shading was corrected to compensate for signal attenuation. Then, statistics from the sonar data were accumulated to determine the dynamic range of the data, and a contrast enhancement was applied. Corrected ship navigation, which accounted for changes in ship speed, was merged with the sonar data, and the data were geographically oriented and displayed on a Mercator grid. After processing, the files were output to a thermal printer. The final image was a manually constructed mosaic. A 5Mbyte scanned version of the final image (hammon.tif) is available for viewing as a graphic in "tif" format
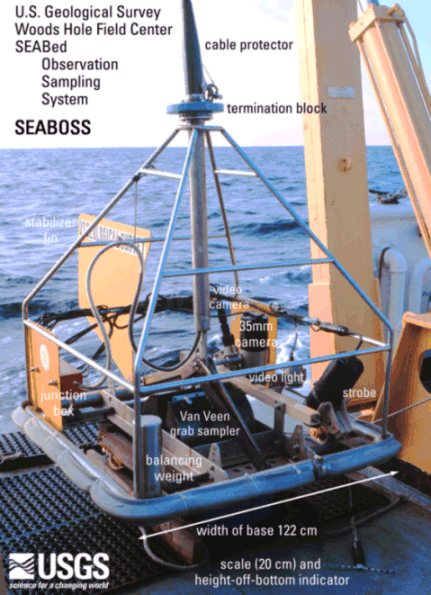
Surficial sediments were sampled and bottom photography attempted at 62 locations during April and May 1995 aboard the RV John Dempsey by means of a Van Veen grab sampler equipped with video and still camera systems (fig. 5). These photographic systems were also used to appraise intra-station bottom variability and to observe boulder fields and bedrock outcrops where sediment samples could not be collected. Surficial sediments (sediments from the sediment-water interface down to 2 cm below the interface) were collected from the grab sampler; these subsamples were frozen and stored for later analysis.
In the laboratory, the sediment samples were corrected for salt content, disaggregated, and wet sieved through a number 230, 62 microns (4 phi) sieve to separate the coarse and fine fractions. The fine fraction was analyzed by Coulter Counter (Shideler, 1976); the coarse fraction was analyzed by sieving (gravel) and by rapid sediment analyzer (sand; Schlee, 1966). Because biogenic carbonates commonly form in situ, they usually are not representative of the depositional environment from a textural standpoint. Therefore, bivalve shells and other biogenic carbonate debris were manually removed from the gravel fraction. Size classifications are based on the method proposed by Wentworth (1929). The verbal equivalents were calculated using the inclusive graphics statistical method (Folk, 1974) and are based on the nomenclature proposed by Shepard (1954). A detailed discussion of the laboratory methods employed are given in Poppe and others (1985); the raw grain-size data, associated statistics, and detailed descriptions of the bottom photography are reported in Poppe and others (1995).
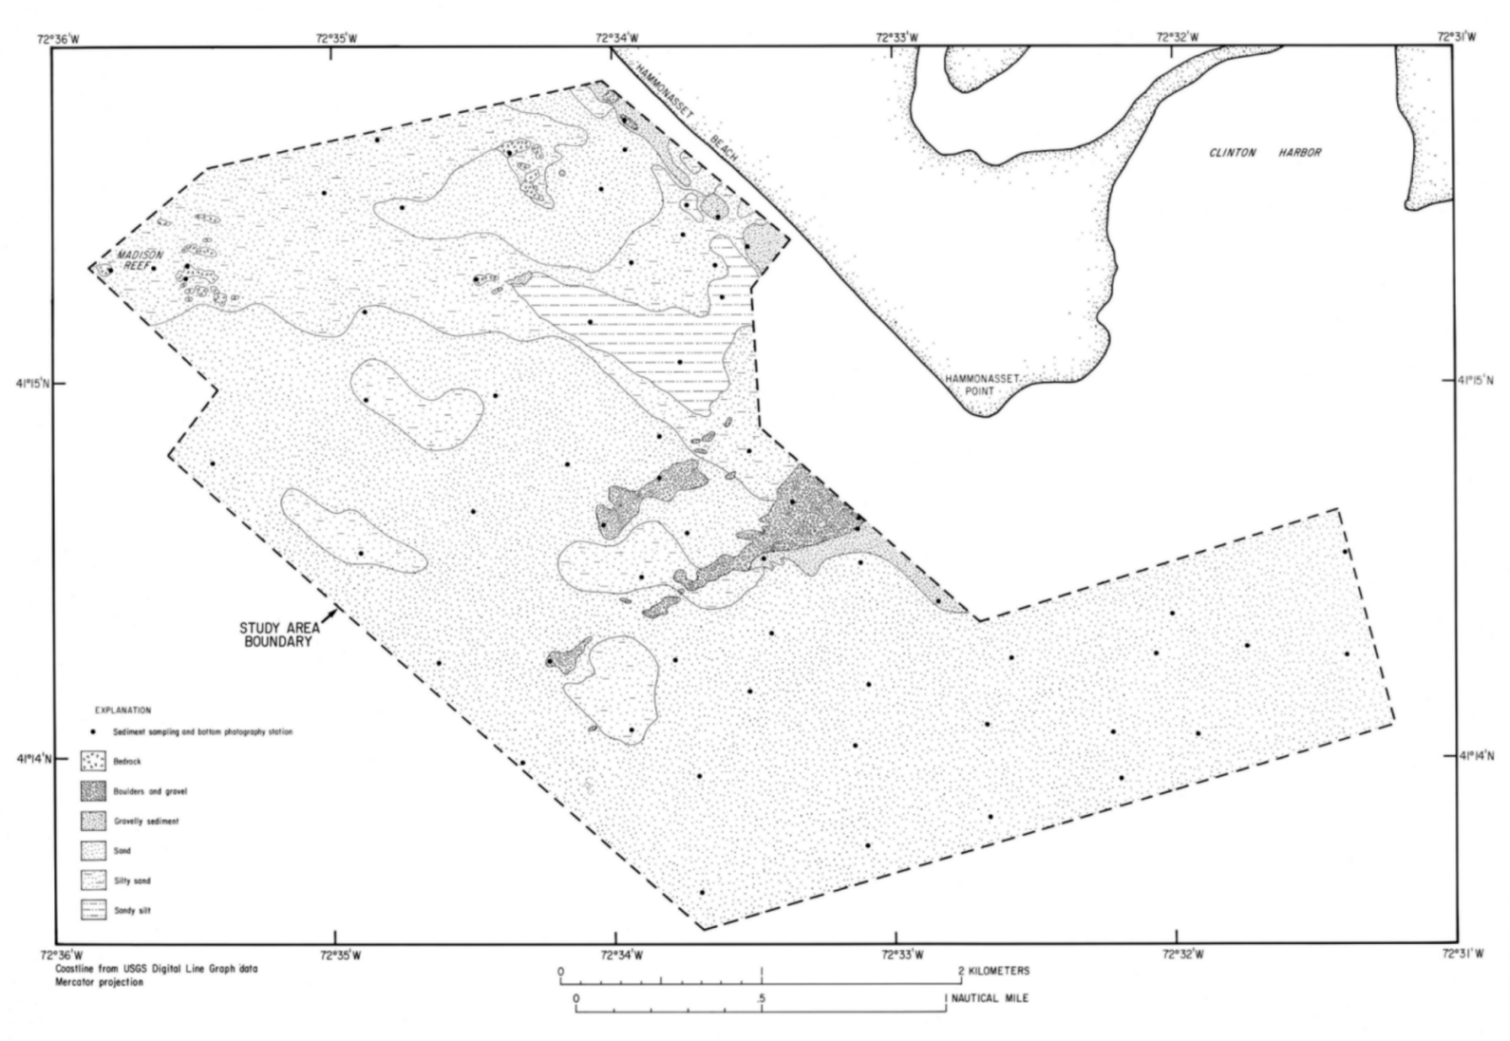
The map of surficial sediment distribution shown in figure 5 is based on data from the sediment sampling and bottom photography stations, on tonal changes in backscatter on the sidescan sonar image, and on the bathymetry.
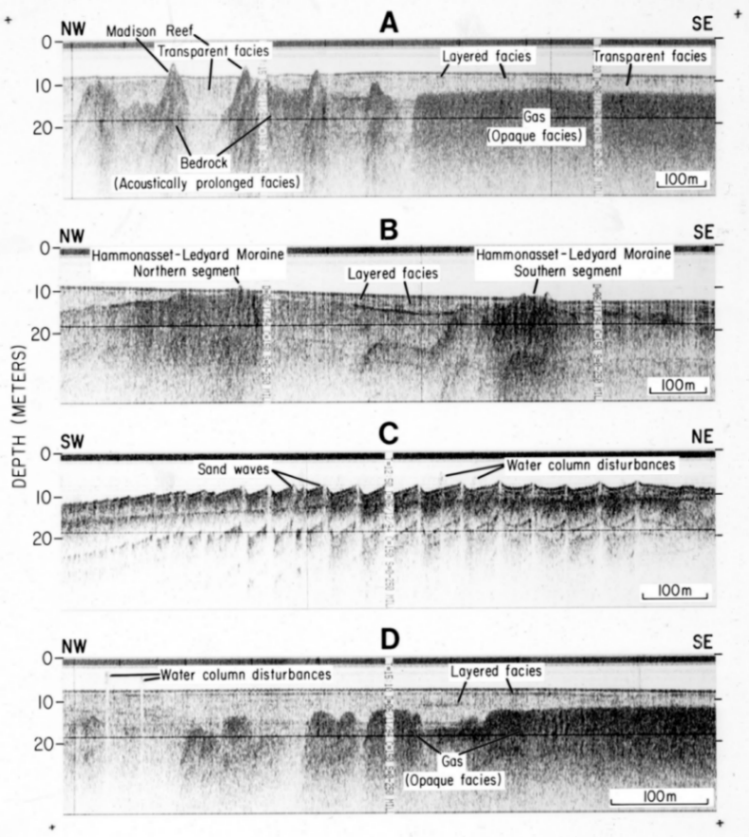
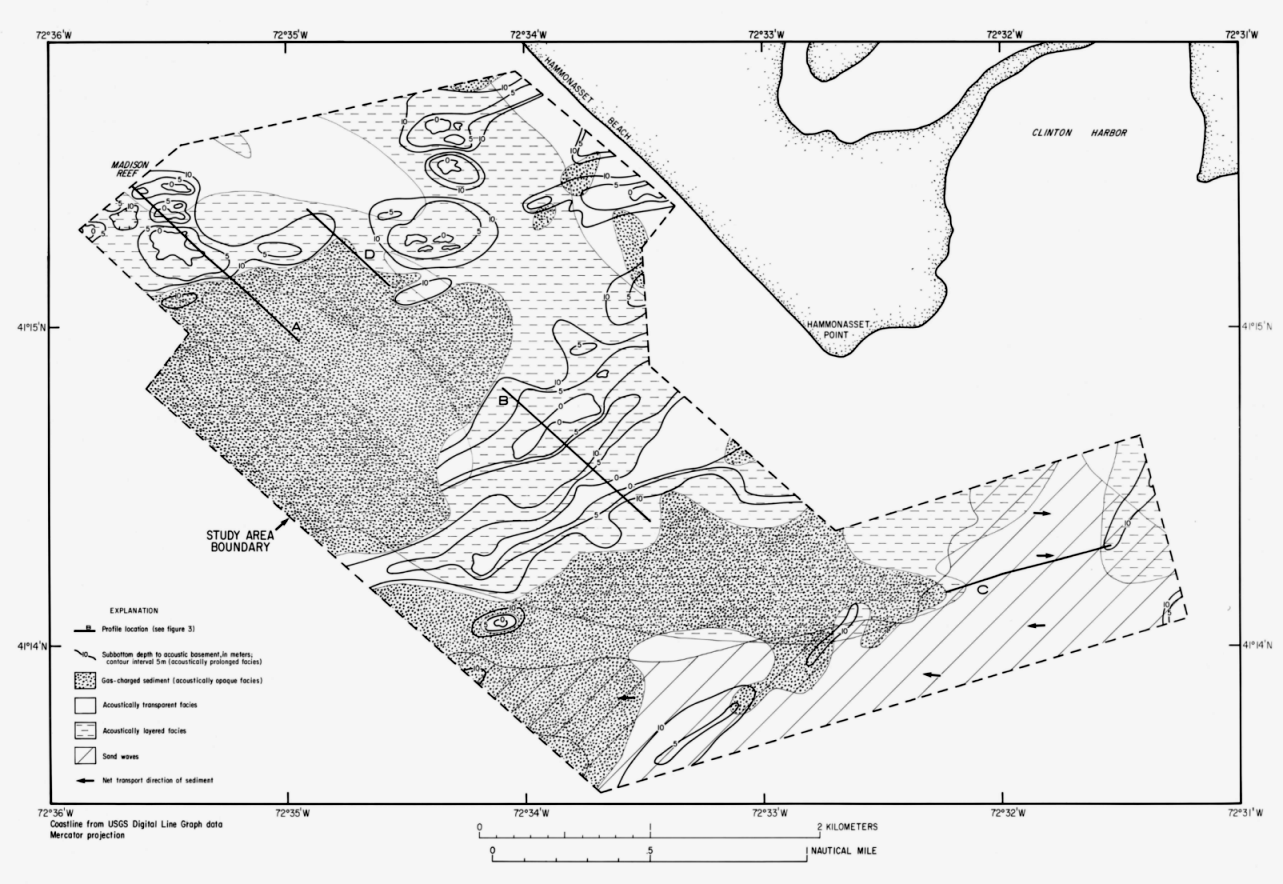
Four acoustic facies were identified on the 3.5-kHz subbottom profiles (fig. 3): prolonged, opaque, transparent, and layered. More than one of these facies may occur together: the layered and transparent facies commonly grade into each other, and gas-charged sediment, which is believed to cause the opaque facies, can be associated with both the layered and transparent facies. Outcropping subbottom units of the prolonged facies and surficial sedimentary structures, such as sand waves, are also recorded on the 3.5-kHz profiles. Disturbances in the water column are commonly present in the 3.5-kHz profiles and are discussed below in relation to the sidescan sonar mosaic.
The acoustically prolonged facies has a highly reflective upper surface that commonly represents acoustic basement (figs. 3 and 4). In the western part of the study area this facies delineates the steep gradients of the bedrock substrate of Madison Reef (fig. 3A); in the central part of the study area this facies is produced by two parallel segments of the Hammonasset-Ledyard Moraine (fig. 3B). Subbottom profiles across the moraine show that the smaller, northern segment overlies and is younger than the southern, main part of the moraine, and that the moraine dips below the surficial sediment cover toward the southwest. The shallow gradient of this surface along the southern extent of the moraine may reflect the accumulation of thick ice-proximal meltwater deposits.
The acoustically opaque facies is interpreted to result from gas-charged sediment (figs. 3A, 3D, and 4). The distribution of this facies is primarily limited to areas where the depth to acoustic basement is relatively greater, such as the area between Madison Reef and the Hammonasset-Ledyard Moraine and the area between the moraine and the sand-wave field. The top of this facies occurs 3-11 m beneath the sediment-water interface. Gas-charged sediment can be associated with both the transparent and layered acoustic facies, but where detected, gas obscures most of the underlying units and acoustic basement in these areas.
The transparent and layered facies, which overlie and are younger than the prolonged acoustic facies, probably represent Holocene deposition. The transparent facies dominates beneath the sand-wave field, along Hammonasset Beach, shoreward of Madison Reef and in elongate patches between the reef and the moraine. The layered facies is more prevalent around the moraine and in the lower-energy areas west of Hammonasset Point.
Sand waves and megaripples cover the southern and eastern parts of the study area (figs. 3C and 4). The average crest-to-trough height of these features is less than 2 m, but occasionally exceeds 3 m; asymmetry of the sand waves suggests that they migrate. Based on the orientations of this asymmetry, the net transport direction is to the east over the northernmost part of the sand-wave field and to the west over the remainder of the field. This distribution suggests that the flood tide is most intense on the south side of the sand-wave field, and that the ebb tide is strongest on the north side.
The corrected bathymetry was contoured at 2-m intervals (fig. 2). Maximum water depths exceed 21 m and occur in the southern and southeastern parts of the study area. Water depths gradually shallow shoreward, around Hammonasset Point, and toward the northwest. The steepest bathymetric gradients occur along the seaward edge of the submerged Hammonasset-Ledyard Moraine and in the eastern part of the study area. Elsewhere, especially at depths shallower than 14 m, the gradients are much gentler.
Isolated bathymetric highs occur in the northwestern, central, and eastern parts of the study area. The highs in the northwestern part of the study area delineate Madison Reef (fig. 3A); in the central part of the study area the highs are related to the northern and southern segments of the Hammonasset-Ledyard Moraine (fig. 3B); and to the east the highs are associated with a sand-wave-covered shoal (fig. 3C). There are few other outlying areas of elevated relief greater than 2 m and the sea floor is generally smooth. Isolated depressions with relief greater than 2 m occur only in the area between the Hammonasset-Ledyard Moraine and the field of sand waves, and between the two segments of the Hammonasset-Ledyard Moraine.
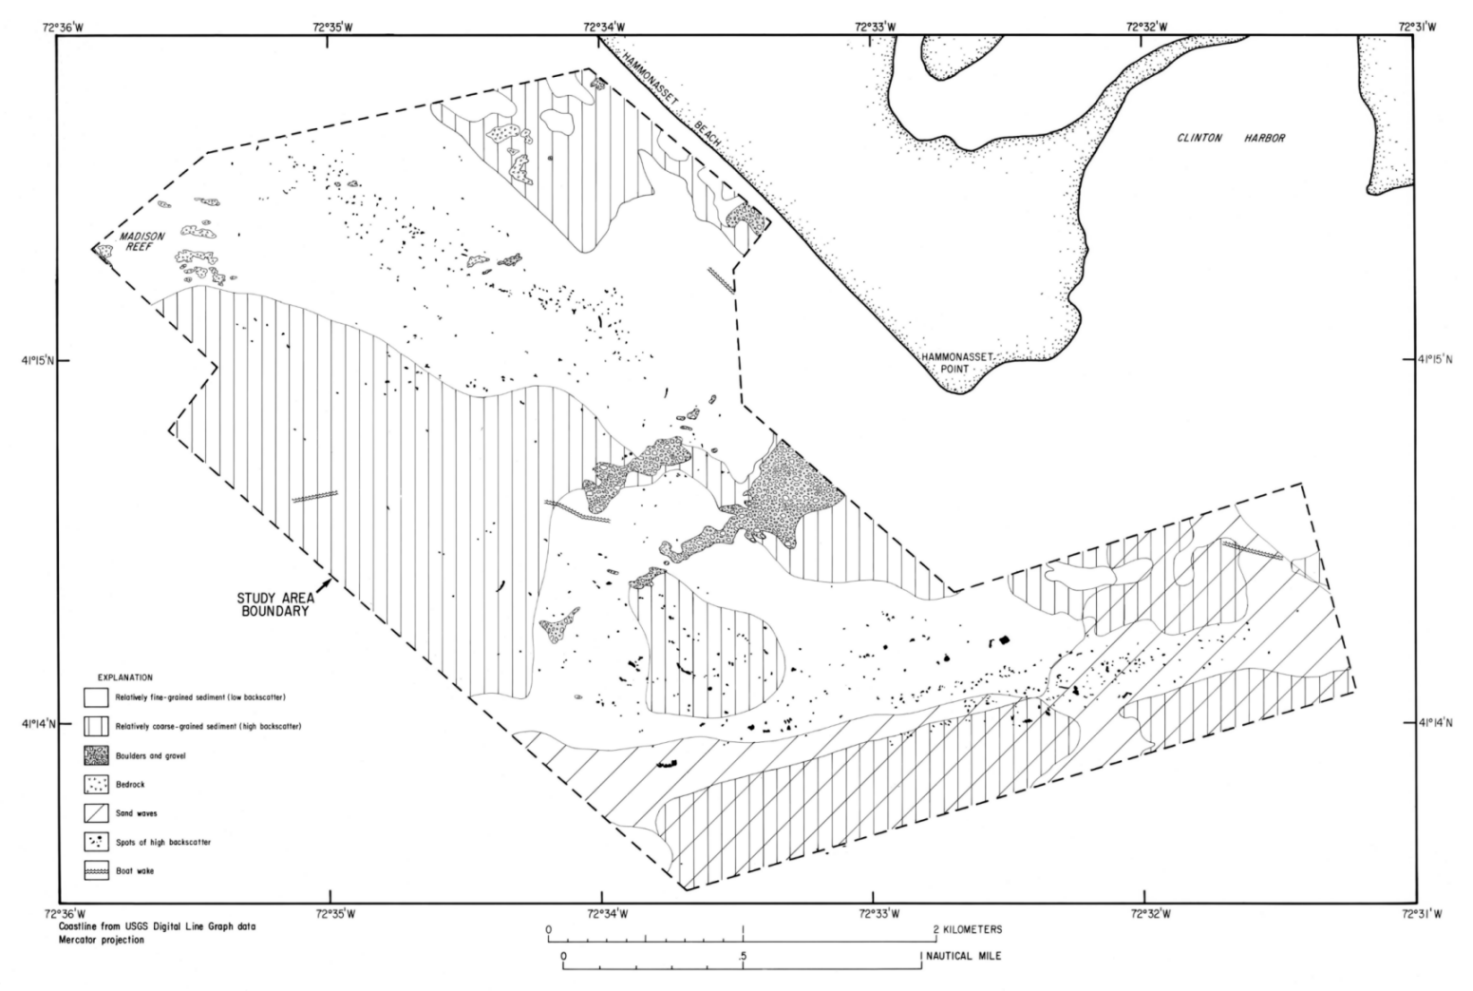
The sidescan sonar mosaic (fig. 6) recreates an acoustic image of the sea floor that, when used in combination with the seismic data (figs. 3 and 4), provides an overall perspective of the benthic character (fig. 7). Distinctive acoustic patterns revealed by this mosaic include the following: outcropping subbottom reflectors (bedrock; boulders and gravel), elongate patches of alternating high and low backscatter (sand waves), areas of low backscatter (dark; probably relatively fine-grained sediment), areas of high backscatter (light; probably relatively coarse-grained sediment), and areally limited spots of high backscatter (light; interpretation is problematic).
Outcrops of subbottom reflectors occur both in the northwestern part of the study area and in southwest-trending linear bands off Hammonasset Point. The outcrops in the northwestern part of the study area are primarily bedrock, probably of the Waterford Group (Lundgren and Thurrell, 1973; Rodgers, 1985), and represent the surface exposures of the Madison Reef substrate. Scattered occurrences of boulders and gravel can be observed adjacent to some of these bedrock outcrops. Southwest of Hammonasset Point subbottom reflectors crop out (fig. 4), but here the sea floor is covered by boulders and gravel (figs. 6 and 7) that are interpreted to be the offshore equivalent of the Hammonasset-Ledyard Moraine. As in some onshore segments of this moraine (Goldsmith, 1980), the offshore part exhibits a characteristic double morphology. These two linear accumulations of boulders and gravel diverge toward the southwest and progressively narrow in surficial extent. About 1.8 km offshore they become discontinuous owing to cover by postglacial sediments. The strong, oscillatory nature of the tidal currents off the seaward end of the exposed moraine is demonstrated by the linear ridges of finer grained sediment that extend both east-southeast and west-northwest from isolated boulders (fig. 6).
Elongate patches of alternating high and low backscatter dominate the southeastern part of the study area (fig. 6). They are interpreted to be sand waves, whose wavelength ranges up to 75 m and which are the result of the strong tidal currents (57-108 cm/s) present in this part of the Sound (Fenster and others, 1990; Eldridge Tide and Pilot Book, 1994). The strike of the bedforms changes from north in the easternmost part of the study area to northeast farther to the west, suggesting a deflection of the tidal currents around Hammonasset Point (fig. 6).
Areas of low backscatter, caused by fine-grained sediment, occur primarily west of Hammonasset Point, between the two linear accumulations of boulders and gravel associated with the submerged part of the Hammonasset-Ledyard Moraine, and adjacent to the area covered by sand waves. These areas, generally characterized by lower energy, are apparently protected from strong tidal and storm conditions. Areas of high backscatter, caused by coarse-grained sediment, occur nearshore and across the southern and western parts of the study area. These areas, generally characterized by higher energy, are apparently exposed to strong tidal and storm conditions.
Isolated spots of high backscatter, which are generally small (about 5-20 m in diameter), are concentrated in two belts. One belt extends along the western flank of the area covered by sand waves; the other lies 1-1.5 km off Hammonasset Beach. Both are associated with areas of the sidescan sonar image that are characterized by low backscatter. Interpretation of these spots is problematic because they may be related to several processes. Water column disturbances on the 3.5-kHz and sidescan sonar records are commonly co-located with these spots of high backscatter (fig. 3C), suggesting that the spots may be variably related to schools of fish, kelp beds, biogenic gas seeps, or, in the case of those spots of high backscatter near the sand-wave field, the resuspension of bottom sediments.
Surficial Sediment Distribution
The surficial sediment distribution and the locations of the sediment sampling and bottom photography stations are shown in figure 5. Interpretation of the sediment distribution is based on data from these stations, on tonal changes in backscatter on the sidescan sonar image (fig. 6), and on the bathymetry (fig. 2). The southeastern part of the study area is primarily characterized by moderately to moderately well sorted sands that have means between 1 and 2f, that have nearly symmetrical, unimodal distributions, and that usually contain less than 15 percent fines (silt and clay). These coarse-grained sands are usually associated with current ripples and commonly contain rounded shell hash. Linear patches of gravel (very fine granules) and shell hash occur commonly in the troughs between the ripple crests.
The central and northwestern parts of the study area are characterized by a patchy distribution of faintly rippled sands and silty sands. The sands are finer grained (means are between 2 and 3f) and less well sorted than those in the southeastern part of the study area. The silty sands are poorly sorted, strongly finely skewed, very leptokurtic, and often bimodal. Scattered patches of shell hash are present.
The finest grained sediments in the study area are poorly sorted, finely-skewed sandy silts. These sediments are restricted to the area just west and west-northwest of Hammonasset Point, where they are apparently protected from strong tidal and storm conditions. Burrowing of the silts by shrimp, polychaetes, and amphipods is extensive; spider crabs are common.
Stations characterized by gravelly sediments are concentrated along Hammonasset Beach and south-southwest of Hammonasset Point. The gravelly nature of the sediments in these areas is probably the result of the winnowing of finer grained sediments by storm- and tidally induced wave and current action. Sandy patches within these areas are rippled and thin (less than about 5 cm), as evidenced by gravel at depth within the grab samples. Starfish, snails, and hermit crabs are common in these gravelly areas.
Sampling was not attempted at stations where bottom photography revealed the presence of boulders or bedrock. These bottoms would have prevented the collection of texturally representative sediment samples and risked damaging the sampling and photographic equipment. Numerous boulders, associated with the offshore extension of the Hammonasset-Ledyard Moraine, were observed in a linear band extending toward the southwest off Hammonasset Point. Bedrock outcrops, associated with Madison Reef, occur in the northwestern part of the study area. Sponges, barnacles, seaweed, and other attached fauna and flora are locally common on the boulders and bedrock outcrops. A thin (less than 2 cm) layer of fine-grained, presumably hemipelagic detritus covers both the bedrock outcrops and boulders. The limited thickness of this layer suggests that it is periodically removed by storm-generated currents.
The present sea floor off Hammonasset Beach State Park has been shaped by both the erosional and depositional processes related to the last glacial advance and retreat and the cumulative effects of transport, reworking, and deposition since the Holocene marine incursion. The integrated 3.5-kHz subbottom profile, bathymetric, sidescan sonar, and sampling surveys presented here show the complex nature of the surficial geology in this area and provide a detailed base map for future studies.
This document was prepared in cooperation with the State of Connecticut, Department of Environmental Protection, Geological and Natural History Survey and the University of New Haven and was originally published as U.S. Geological Survey Geologic Investigations Map I-2588.
We thank Amy Harmon (USGS) and Doug Wheat (Yale University) for assistance in the field; Dave Olmsted, who captained the Woods Hole Oceanographic Institution vessel RV Asterias; Peter Simpson and Miles Peterle, who operated the Connecticut Department of Environmental Protection vessel RV John Dempsey; and Jeffrey Shapiro of the Cedar Island Marina, Clinton, Conn., for providing logistical support. Mean sea-level tidal-height measurements used to correct the bathymetric data were computed by Michael McCray at the Tidal Analysis Branch of the National Oceanographic and Atmospheric Administration. Any use of trade, product, or firm names is for descriptive purposes only and does not imply endorsement by the U.S. Government, the State of Connecticut, and the University of New Haven.
Danforth, W.W., O'Brien, T.F., and Schwab, W.C., 1991, USGS image processing system: near real-time mosaicing of high resolution side scan SONAR data: Sea Technology, v. 32, p. 54-60.
Eldridge Tide and Pilot Book, 1994: Boston, Marion Jewett White, 272 p.
Fenster, M.S., Fitzgerald, D.M., Bohlen, W.F., Lewis, R.S., and Baldwin, C.T., 1990, Stability of giant sand waves in eastern Long Island Sound, U.S.A: Marine Geology, v. 91, p. 207-225.
Flint, R.F., 1971, The surficial geology of the Guilford and Clinton Quadrangles with map: Connecticut Geological and Natural History Survey, Quadrangle Report No. 28, 33 p., 3 sheets, scale 1:24,000.
Folk, R.L., 1974, The petrology of sedimentary rocks: Austin, Tex., Hemphill Publishing Co., 182 p.
Goldsmith, Richard, 1980, Recessional moraines and ice retreat in southeastern Connecticut, in Larson, G.J., and Stone, B.D. (eds.), Late Wisconsinan glaciation of New England: Dubuque, Iowa, Kendall/Hunt Publishing Co., p. 61-76.
Lewis, R.S., and Needell, S.W., 1987, Maps showing the stratigraphic framework and Quaternary geologic history of eastern Long Island Sound: U.S. Geological Survey Miscellaneous Field Studies Map MF-1939-A, 3 sheets and pamphlet, scale 1:125,000.
Lewis, R.S., and Stone, J.R., 1991, Late Quaternary stratigraphy and depositional history of the Long Island Sound basin, Connecticut and New York: Journal of Coastal Research, Special Issue 11, p. 1-23.
Long Island Sound Study, 1994, Comprehensive conservation and management plan: U.S. Environmental Protection Agency Report, 168 p.
Lundgren, Lawrence, and Thurrell, R.F., 1973, The bedrock geology of the Clinton Quadrangle with map: Connecticut Geological and Natural History Survey, Quadrangle Report No. 29, 22 p., 1 sheet, scale 1:24,000.
Moffett, A.M., Poppe, L.J., and Lewis, R.S., 1994, Trace metal concentrations in sediments from eastern Long Island Sound: U.S. Geological Survey Open-File Report 94-620, 17 p.
Needell, S.W., Lewis, R.S., and Colman, S.M., 1987, Maps showing the Quaternary geology of east-central Long Island Sound: U.S. Geological Survey Miscellaneous Field Studies Map MF-1939-B, 3 sheets and pamphlet, scale 1:125,000.
Poppe, L.J., Eliason, A.H., and Fredericks, J.J., 1985, APSAS--An Automated Particle Size Analysis System: U.S. Geological Survey Circular 963, 77 p.
Poppe, L.J., Lewis, R.S., and Moffett, A.M., 1992, The texture of surficial sediments in northeastern Long Island Sound:U.S. Geological Survey Open-File Report 92-550, 13 p.
Poppe, L.J., Harmon, A.E., Taylor, B.B., Blackwood, Dann, and Lewis, R.S., 1995, The texture of surficial sediments in north-central Long Island Sound off Hammonasset Beach State Park, Connecticut: U.S. Geological Survey Open-File Report 95-556, 15 p.
Rodgers, John (compiler), 1985, Bedrock geologic map of Connecticut: Connecticut Geological and Natural History Survey, 2 sheets, scale 1:125,000.
Schlee, J., 1966, A modified Woods Hole rapid sediment analyzer: Journal of Sedimentary Petrology, v. 30, p. 403-413.
Shepard, F.P., 1954, Nomenclature based on sand-silt-clay ratios: Journal of Sedimentary Petrology, v. 24, p. 151-158.
Shideler, G.L., 1976, A comparison of electronic particle counting and pipette techniques in routine mud analysis: Journal of Sedimentary Petrology, v. 42, p. 122-134.
Stone, J.R., Schafer, J.P., London, E.H., and Thompson, W.B., 1992, Surficial materials map of Connecticut: U.S. Geological Survey Special Map, 2 sheets, scale 1:125,000.
Twichell, D.C., Poppe, L.J., Zajac, Roman, and Lewis, R.S., 1995, Sidescan sonar survey of the Long Island Sound sea floor off Milford, Connecticut: Geological Society of America Abstracts with Programs, v. 27, p. 88.
Twichell, D.C., Zajac, R.N., Poppe, L.J., Lewis, R.S., Cross, VeeAnn, Nichols, David, and DiGiacomo-Cohen, M.L., 1996, Sidescan sonar image, surficial geologic interpretation, and bathymetry of the Long Island Sound sea floor off Norwalk, Connecticut: U.S. Geological Survey Geologic Investigations Map I-2589, 2 sheets.
Wentworth, C.K., 1929, Method of computing mechanical composition of sediments: Geological Society of America Bulletin, v. 40, p. 771-790.
Figure 1. Map showing location of study area off Clinton, Conn. Also shown are the major onshore moraines and the locations of other sidescan sonar surveys being completed as part of this series (Norwalk: Twichell and others (1996); Milford: Twichell and others (1995); New London: Poppe and others (1992); Moffett and others (1994)).
Figure 2. Bathymetric map of the study area. Contour interval 2 meters. Depths have been corrected for tides and are adjusted to mean sea level. Fine dashed lines represent tracks along which the geophysical data were collected. Locations of profiles A, B, C, and D, shown in figure 3, are indicated.
Figure 3. Subbottom profiles (3.5-kHz) showing different echo- character types. (A) Profile shows the acoustically prolonged facies interpreted to be the bedrock substrate of Madison Reef and the acoustically opaque facies interpreted to represent gas-charged sediment. The upper, highly reflective surface of the prolonged facies commonly represents acoustic basement. (B) Profile shows the prolonged seismic character and twin segments of the Hammonasset-Ledyard Moraine. C) Profile shows sand waves and seismic returns from the water column possibly caused by fish, biogenic gas seeps, kelp beds, or resuspended sediment. (D) Profile shows the acoustically opaque facies interpreted to be the result of gas-charged sediment, and seismic returns from the water column causing some of the high-backscatter spots shown in figures 6 and 7. Locations of the profiles are shown in figures 2 and 4.
Figure 4. Near-surface echo-character map showing the distribution of the four acoustic facies: prolonged, opaque, transparent, and layered. The prolonged facies commonly represents acoustic basement, and the opaque facies is interpreted to be the result of gas in the sediments. The prolonged facies coincides with the sea floor within the 0-m contour. Figure also indicates the location of profiles A, B, C, and D, shown in figure 3.
Figure 5. Map showing the distribution of surficial sediments and the locations of the sediment sampling and bottom photography stations. Interpretation of the sediment distribution is based on data from these stations, on tonal changes in backscatter on the sidescan sonar image (fig. 6), and on the bathymetry (fig. 2).
Figure 6. Sidescan sonar mosaic of the sea floor in the study area. Light tones on the image represent areas of high backscatter; dark tones represent areas of low backscatter.
Figure 7. Interpretation of the sidescan sonar mosaic. Different patterns are defined in the explanation and discussed in the text.
A 5Mbyte scanned version of a manually-constructed, analog sidescan sonar image (hammon.tif) is available for viewing as a graphic in "tif" format
[an error occurred while processing this directive]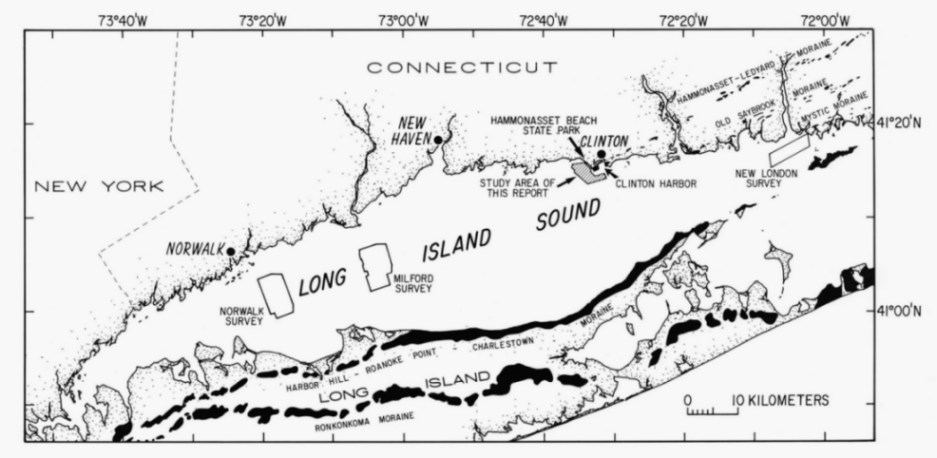