CHAPTER 3. SURFICIAL SEDIMENT DATABASE
Lawrence J. Poppe1, Mary E. Hastings1, Mary L.
DiGiacomo-Cohen2,
Frank T. Manheim1, and Zofia J. Mlodzinska3
1
US Geological Survey, Woods Hole, MA 02543
Grain size (texture) of sediments is a basic physical parameter required for environmental, mineral resource, sediment transport, and other assessments. Blatt and others (1972), Folk (1974), and Syvitski (1991) further elaborate on some of the uses for this parameter: 1) Grain size is the most fundamental property and descriptive measure of a sediment. 2) Grain size distributions are characteristic of sediments deposited in certain environments. 3) Detailed study of observed grain-size distributions often yield information about the physical mechanisms that occurred during transport, deposition, and diagenesis. 4) Grain size can often be related to other properties such as permeability, cohesiveness, or stability, and variations in these properties may be predicted from variations in grain size. 5) Community structures are often related to grain size distributions, because many benthic organisms exhibit affinities for specific sediment textures. 6) Contaminants are often associated with fine-grained sediments because of adsorption onto the charged surfaces of clay minerals and the large grain surface area available for adsorption.
Many scientific questions and policy issues related to sediments in Long Island Sound require data of historical, regional and interdisciplinary scope. Existent data is often geographically clustered and its references are widely dispersed and not always accessible. Acquisition of new data is expensive and may duplicate previous efforts if a full interpretation of existent data has not occurred. Consequently, the body of existing data needs to be utilized to its maximum so that it can serve as a foundation, baseline, and starting point for further work. An accessible, documented, and simple-to-use compilation of existing data on sediment properties is essential for environmental managers, policy-makers, scientific researchers, and interested members of the public. To this end, we have compiled, edited, and integrated the available data on sediment texture and bottom descriptions throughout the Sound in order to produce a regional database which will be available to a wide variety of current and potential users. The significant feature of this database is that it comprehensively contains original data from many heterogeneous sources. Hopefully it will grow and evolve, remaining applicable to questions and models developed in the future.
The Long Island Sound surficial sediment database is a compilation from earlier sources and new data, which are listed below in the source bibliography. This bibliography was generated in conjunction with the database in order to document the original references so that users could refer to them if necessary. Most records are simple bottom descriptions from the National Oceanographic Service database (National Geophysical Data Center, 1987). They're value is enhanced by the data from other published and unpublished sources. Most of the samples were collected with some type of grab sampler, however, a few were obtained by coring.
The published and unpublished textural data produced by the U.S. Geological Survey were generated from samples collected between 1992-1998 aboard the State of Connecticut Department of Environmental Protection vessel RV John Dempsey, the U.S. Environmental Protection Agency vessel RV Anderson, and the Woods Hole Oceanographic Institution vessel RV Asterias using a Van Veen grab sampler. This grab sampler was equipped with Osprey video and still camera systems; the video system was attached to an 8 mm video cassette recorder. These photographic systems were used to appraise intra-station bottom variability and to observe boulder fields and bedrock outcrops where sediment samples could not be collected. The 0-2 cm interval in the surficial sediments was subsampled from the grab sampler; these samples were frozen and stored for later analysis. Navigation was performed using a differential Global Positioning Satellite system.
The samples were thawed and visually inspected in the laboratory. If the sample contained gravel, the entire sample was analyzed. If the sample was composed of only sand, silt, and clay, an approximately 50-gram, representative split was analyzed. The sample to be analyzed was placed in pre-weighed 100 ml beaker, weighed, and dried in a convection oven set at 75 oC. When dried, the samples were placed in a desiccator to cool and then weighed. The decrease in weight due to water loss was used to correct for salt; salinity measurements averaged 26 o/oo. The weight of the sample and beaker less the weight of the beaker and the salt correction gave the sample weight.
The samples were disaggregated and then wet sieved through a number 230, 62 microns (4 phi) sieve using distilled water to separate the coarse- and fine-fractions. The fine fraction was sealed in a Mason jar and reserved for analysis by Coulter Counter (Shideler, 1976). The coarse fraction was washed in tap water and reintroduced into the pre-weighed beaker. The coarse fraction was dried in the convection oven at 75 oC and weighed. The weight of the coarse (greater than 62 microns) fraction is equal to the weight of the sand plus gravel. The weight fines (silt and clay) can also be calculated by subtracting the coarse weight from the sample weight. The coarse fraction was dry sieved through a number 10, 2.0 mm (-1 phi) sieve to separate the sand and gravel. The size distribution within the gravel fraction was determined by sieving. Because biogenic carbonates commonly form in situ, they are not representative of the depositional environment from a textural standpoint. Therefore, bivalve shells and other biogenic debris greater than 0 phi (1.0 mm) were manually removed from the samples and the weights corrected to mitigate this source of error.
If the sand fraction contained more than 16 grams of material (enough to run the analysis twice), a rapid sediment analyzer (Schlee, 1966) was used to determine the sand distribution. If less than 16 grams of sand were available, the sand fraction was dry sieved using a Ro-Tap shaker.
The fine fraction was analyzed by Coulter Counter. To mitigate biologic or chemical changes, storage in the Mason jars prior to analysis never exceeded five days. The gravel, sand, and fine fraction data were processed by computer to generate the distributions, statistics, and data base files (Poppe and others, 1985). One limitation of using a Coulter Counter to perform fine fraction analyses is that it has only the ability to "see" those particles for which it has been calibrated. Calibration for this study allowed us to determine the distribution down to 0.6 microns or about two-thirds of the 11 phi fraction. Because clay particles finer than this diameter and all of the colloidal fraction were not determined, a slight decrease in the 11 phi (and finer) fraction is present in the size distributions.
Size classifications are based on the method proposed by Wentworth (1929); the statistics were calculated using the method of moments (Folk, 1974). The verbal equivalents were calculated using the inclusive graphics statistical method (Folk, 1974) and are based on the nomenclature proposed by Shepard (1954). Most of the other sources that supplied basic data used laboratory methods described by Krumbein and Pettijohn (1938), Folk (1954, 1968, 1974), or Galehouse (1971), but some only specified general techniques (i.e. sieving). As with the data generated by the U.S. Geological Survey, the textural scales were typically modified from the one proposed by Wentworth (1929) and lithologic classifications were most commonly modified from the nomenclature proposed by Shepard (1954). Statistical methods employed include both the method of moments (Griffiths, 1967) and inclusive graphics (Folk, 1974).
Laboratory Methods: Organic Carbon, Hydrogen, and Nitrogen
The frozen sediments were thawed at room temperature and homogenized. A 0.5-g subsample was removed; large animals and shell fragments were avoided during subsampling. The samples were dried overnight in a convection oven at 60oC and then placed in a desiccator containing concentrated HCL and allowed to fume for 24-48 hours to remove the carbonates. This vapor phase acidification converts the calcium carbonate in the sample to water vapor, CO2, and calcium chloride (Mayer and Macko, 1988; Zimmermann and others, 1992). Techniques that introduce the sample directly into an acid to dissolve the calcium carbonate were avoided because of the loss of dissolved organic carbon with the discarded filtrate (Roberts and others, 1973). After 12 hours of fuming, the samples were removed, disaggregated with a spatula to ensure that all carbonate was exposed to the HCL fumes, and returned to the fuming desiccator.
The decalcified samples were dried at 60oC overnight and ground by mortar and pestle to a fine (<.062 mm) homogeneous powder. The powdered samples were placed into prelabeled glass vials, redried at 60oC, and stored in a desiccator with Drierite until analysis. Analysis was performed on a Perkin Elmer 2400 CHN Elemental Analyzer by analyzing their combustion products (CO2,H2O, and N2). Combustion occurred in pure oxygen under static conditions at 1000oC. About 40 percent of the runs were blanks or standards, run as a means of calibrating the instrument and checking precision. Precision was always better than one standard deviation. The organic carbon data from one other source were included in the database (Akpati, 1974) because they supply values from Fishers Island Sound, an area not covered by the USGS data. These data were produced Leco carbon analyzer; organic carbon values were obtained by the difference between the total carbon and carbonate (inorganic) carbon. Although organic carbon data were produced by a few of the other studies, these data were generated by loss on ignition and are not included because they are considered to be much less accurate. Nitrogen concentrations determined by combustion in an elemental analyzer tend to be slightly higher than those values determined by the micro Kjeldahl method (Kabat and Mayer, 1948). Lower numbers are produced by the micro Kjeldahl method because this technique may not detect all of the refractory nitrogen included in the data generated by the combustion method. The ratio of organic carbon content to nitrogen content is given as a molar elemental ratio.
Our objective was to gather all of the available data on texture for the bottom sediments of Long Island Sound into a scientifically-edited database that will allow scientists, policy makers, and others to manipulate, query, and display the original data themselves to address their own specific applications. Requirements for the database formats are that they be comprehensive and simple to both enter and extract data.
The basic structure of the database is a matrix where records are rows and the columns contain information on sample identification, navigation, classifications, analyzed parameters, and comments. This structure was chosen to avoid ambiguity, and to make the process of locating fields, entering data, and validating it as simple yet comprehensive as possible. The database presented here contains over 14,000 records and 83 fields (see the Data Dictionary below). The specific fields and parameters have been chosen based on the data produced by the sedimentation laboratory of the Coastal and Marine Geology Program of the U.S. Geological Survey in Woods Hole, Mass., and the format of information typically found in the literature. Because the data have come from numerous sources, there are differing amounts and types of information. Most of the samples or sets of samples do not have data in all of the given fields. However, additional fields, qualifiers, and data can be added in virtually unlimited fashion to accommodate specific needs.
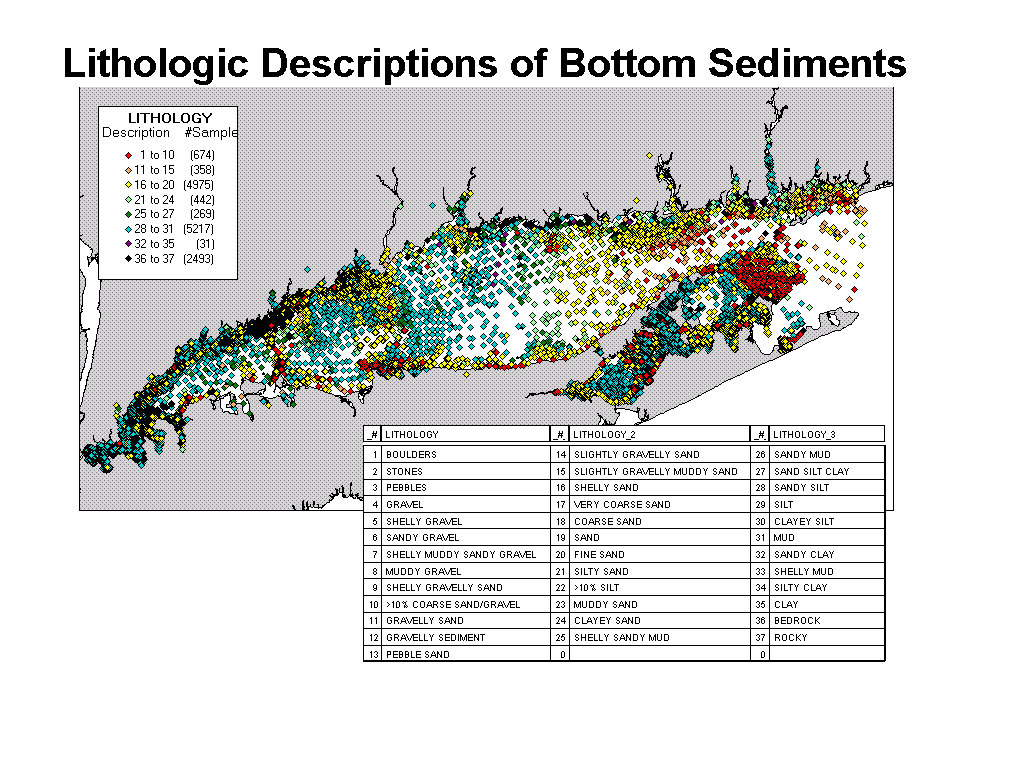
VISUALIZATION OF THE TEXTURAL DATABASE
As has been mentioned, the bulk of the textural data are comprised of general lithologic descriptions (fig. 1). Those samples for which full grain-size data are available were also assigned classifications (fig. 2) based on definitions found in Shepard (1954). The display of these two separate parameters gives a good overview of the textural distributions within the Sound. In displaying the lithologic descriptors the general ranking principle of the main constituents (e.g. gravel, sand) and modifying constituents (e.g. sandy, silty) follows in order of decreasing coarseness. The color display follows this pattern:
Black - bedrock, rocky
Red - sediment whose main phase is gravel
Orange - sediment with significant amounts of gravel
Yellow - sediment whose main phase is sand without significant gravel or mud
Green - sand with significant silt, clay, or mud
Blue - sediments whose main phase is silt
Purple - sediments whose main phase is clay
The database itself is provided in five formats: three popular software formats, a
delimited ASCII text file, and a compressed version of this file for those who encounter
difficulty loading the 2.8-MB text file into the browser. All were created in Microsoft EXCEL, Version 5.1.
The formatted
files will open in the appropriate software if you have the applications installed and
your web browser is properly configured. In the delimited ASCII text file, which can be
downloaded into many types of software, each field or column of data is separated from the
next by a tab.
* listex.xls Microsoft EXCEL, ver. 5 (6.6 MB)
* listex.wql Quattro Pro for Windows (3 MB)
* listex.dbf Dbase IV (11 MB)
* listex.txt Tab-delimited text (2.8 MB)
* listex.zip Compressed version of the tab-delimited text (320 KB)
Blatt, Harvey, Middleton, Gerard, and Murray, Raymond, 1972, Origin of Sedimentary Rocks: New Jersey, Prentice Hall, 633 p.
Folk, R.L., 1954, The distinction between grain size and mineral composition in sedimentary rock nomenclature: Journal of Geology, v. 62, p. 344-359.
Folk, R.L., 1968, Petrology of Sedimentary Rocks,: Austin, Tx, Hemphill Publishing Co., 170 p.
Folk, R.L., 1974, The petrology of sedimentary rocks: Austin, Tx, Hemphill Publishing Co., 182 p.
Galehouse, J.S., 1971, Sedimentation analysis, In: R.E. Carver (Ed.) Procedures in Sedimentary Petrology, John Wiley and Sons, Inc., New York, 653 p.
Griffiths, J.C., 1967, Scientific methods and analysis of sediments: New York, N.Y., McGraw Hill, 508 p.
Kabat, E.A. and Mayer, M.M., 1948, Volumetric determination of aminoid nitrogen, In Experimental Immunochemistry, Springfield, Illinois, C.C. Thomas Co., 567 p.
Krumbein, W.C., and Pettijohn, F.J., 1938, Manual of Sedimentary Petrology: New York, Appleton, Century, and Crofts, Inc., 549 p.
Mayer, L.M., Macko, S.A., and Cammen, Leon, 1988, Provenance, concentrations, and nature of sedimentary organic nitrogen in the Gulf of Maine: Marine Geochemistry, v. 25, p. 291-304.
Roberts, A.A., Palacas, J.G., and Frost, I.C., 1973, Determination of organic carbon in modern carbonate sediments: Journal of Sedimentary Petrology, v. 43, p. 1157-1159.
Poppe, L.J., Eliason, A.H., and Fredericks, J.J., 1985, APSAS - An automated particle size analysis system: U.S. Geological Survey Circular 963, 77 p.
Schlee, J., 1966, A modified Woods Hole rapid sediment analyzer: Journal Sedimentary Petrology, v. 30, p. 403-413.
Shepard, F.P., 1954, Nomenclature based on sand-silt-clay ratios: Journal Sedimentary Petrology, v. 24, p. 151-158.
Shideler, G.L., 1976, A comparison of electronic particle counting and pipette techniques in routine mud analysis: Journal of Sedimentary Petrology, v. 42, p. 122-134.
Syvitski, J.P.M. (Ed), 1991, Principles, Methods, and Applications of Particle Size Analysis: New York, Cambridge University Press, 368 p.
Wentworth, C.K., 1929, Method of computing mechanical composition of sediments: Geological Society of America Bulletin, v. 40, p. 771-790.
Zimmermann, C.F., Keefe, C.W., Bashe, Jerry, 1992, Method 440.0 - Determination of carbon and nitrogen in sediments and particulates of estuarine/coastal waters using elemental analysis: U.S. Environmental Protection Agency Environmental Monitoring and Support, Supplement to Methods for Chemical Analysis and Waste, National Technical Information Service, Department of Commerce, Revision 1.4, sec. 11.4.2.
The following references supply control point locations and basic textural and (or) organic carbon data or interpretations. The references are listed by author in alphabetical order. The number of records and type of data supplied to the database by an individual reference is given in the associated brackets.
Akpati, B.N., 1974, Mineral composition and sediments in eastern Long Island Sound, New York: Maritime Sediments, v. 10, p. 19-30 [texture: 61; organic carbon: 51].
Bertoni, M.S., 1965, Geological and geophysical investigation of Block Island Sound between Fishers and Gardiners Islands: Dissertation, University of Connecticut, Storrs, CT, 127 p. [texture: 24]
Bokuniewicz, H.J., Gordon, R.B., and Kastens, K.A., 1977, Form and migration of sand waves in a large estuary, Long Island Sound: Marine Geology, v. 24, p. 185-199. [texture: 62]
Bragerhuff, K.E, and Paiva, M.A., 1993, Proposed maintenance dredging of Stony Creek Harbor and Federal Channel, Branford, Connecticut: Environmental Assessment, Department of the Army, New England Division, 24 p. [texture: 3]
Brown, S.E., Waterman, E.R., and Demos, C.J., 1986, Maintenance dredging of New Haven Harbor, Connecticut: Environmental Assessment, Department of the Army, New England Division, Corps of Engineers, 42 p. [texture: 30]
Buzas, M.A., 1965, The distribution and abundance of foraminifera in Long Island Sound: Smithsonian Miscellaneous Collections, v. 149, no. 1, 89 p. [texture: 54]
Demos, C.J., Atwood, Kathleen, 1992, Maintenance dredging of Guilford Harbor: Environmental Assessment, Department of the Army, New England Division, Corps of Engineers, 21 p. [texture: 7]
Donohue, J.J., and Tucker, F.B., 1970, Marine mineral identification survey of coastal Connecticut: United Aircraft research Laboratories, East Hartford, Connecticut, Final Report J-970660-1, 305 p. [texture: 45]
Gross, M.G., Davies, D., Lin, P.M., and Loeffler, W., 1972, Characteristics and environmental quality of six north shore bays, Nassau and Suffolk counties, Long Island, New York: Marine Sciences Research Center, State University of New York, Technical Report Series No. 14, 98 p. [texture: 127]
Haskell, N.L., 1977, Long Sand Shoal: Dissertation, University of Connecticut, Storrs, CT, 142 p. [texture: 300].
Hathaway, J.C., 1971, Data File - Continental Margin Program: Woods Hole Oceanographic Institution Technical Report 71-15, 492 p. [texture: 15]
Horowitz, J.L., 1984, Clinton Harbor maintenance dredging, Clinton, Conecticut: Environmental Assessment, Department of the Army, New England Division, Corps of Engineers, 10 p. [texture: 6]
Hubbard, W.A., 1985, Proposed maintenance dredging of the Thames River and New London harbor channel, New London, Connecticut: Environmental Assessment, Department of the Army, New England Division, Corps of Engineers, 38 p. [texture: 9]
Lewis, R.S., and Needell, S.W., 1987, Maps showing the stratigraphic framework and quaternary geologic history of eastern Long Island Sound: U.S. Geological Survey Miscellaneous Field Studies Map MF-1939-A, 7 p., 3 sheets. [texture: 14]
National Oceanographic Atmospheric and Administration, 1998, National Status and Trends Program: Office of Ocean Resource Conservation and Assessment World Wide Web Site, http://seaserver.nos.noaa.gov. [texture: 119]
National Geophysical Data Center, 1987, National Ocean Survey hydrographic data base: National Oceanographic and Atmospheric Administration Data Announcement 87-MGG-12, 8 p. [texture: 10,975]
National Ocean Service, 1993, Long Island Sound - Eastern Part: National Oceanographic and Atmospheric Administration, Washington, D.C., Chart 12354, 1 sheet, scale 1:80,000. [texture: 242]
Needell, S.W., Lewis, R.S., and Colman, S.M., 1987, Maps showing the Quaternary geology of east-central Long Island Sound: U.S. Geological Survey Miscellaneous Field Studies Map MF-1939-B, 3 sheets. [texture: 7]
Pellegrino, P.E., and Hubbard, W.A., 1983, Baseline Shellfish data for the assessment of potential environmental impacts associated with energy activities in Connecticut=s coastal zone: State of Connecticut department of Agriculture, Aquaculture Division, v. 1 and 2. [texture: 402]
Poppe, L.J., Lewis, R.S., and Moffett, A.M., 1992, The texture of surficial sediments in northeastern Long Island Sound: U.S. Geological Survey Open-File Report 92-550, 13 p. [texture: 57]
Poppe, L.J., Lewis, R.S., and Moffett, A.M., 1993, The texture of surficial sediments in Fishers Island Sound: U.S. Geological Survey Open-File Report 93-214, 28 p. [texture: 239]
Poppe, L.J., Harmon, A.E., Taylor, B.B., Blackwood, Dann, and Lewis, R.S., 1995, The texture of surficial sediments in north-central Long Island Sound off Hammonasset Beach State Park, Connecticut: U.S. Geological Survey Open-File Report 95-556, 15 p. [texture: 64]
Poppe. L.J., Taylor, B.B., Harmon, A.E., Zajac, R.N., Lewis, R.S., Blackwood, Dann, DiGiacamo-Cohen, M.L., 1996a, The texture of surficial sediments in western Long Island Sound off the Norwalk Islands, Connecticut: U.S. Geological Survey Open-File Report 96-08, 19 p. [texture: 71]
Poppe, L.J., Taylor, B.B., Zajac, R.N., Lewis, R.S., Blackwood, Dann, DiGiacomo-Cohen, M.L., 1996b, The texture of surficial sediments in central Long Island Sound off Milford, Connecticut: U.S. Geological Survey 96-14, 20 p. [texture: 79]
Poppe, L.J., Taylor, B.B., Blackwood, Dann, Lewis, R.S., and DiGiacomo-Cohen, M.L., 1996c, The texture of surficial sediments near Niantic Bay, Connecticut, U.S. Geological Survey Open-File Report 96-271, 16 p. [texture: 69]
Poppe, L.J., Zajac, R.N., Lewis, R.S., Mlodzinska, Z.J., Pratt, S.E., Taylor, B.B., and DiGiacomo-Cohen, M.L., 1996, Organic carbon, hydrogen, and nitrogen concentrations in surficial sediments from western Long Island, Connecticut and New York: U.S. Geological Survey Open-File Report 96-708, 20 p. [organic carbon: 147]
Poppe, L.J., Taylor, B.B., Blackwood, Dann, Lewis, R.S., and DiGiacomo-Cohen, M.L., 1997a, The texture of surficial sediments in eastern Long Island Sound near Falkner Island, Connecticut: U.S. Geological Survey Open-File Report 97-251, 17 p. [texture: 46]
Poppe, L.J., Taylor, B.B., Blackwood, Dann, Lewis, R.S., and DiGiacomo-Cohen, M.L., 1997b, The texture of surficial sediment in southeastern Long Island Sound off Roanoke Point, New York: U.S. Geological Survey Open-File Report 97-529, 18 p. [texture: 50]
Poppe, L.J., Robinson, A.C., Blackwood, Dann, Lewis, R.S., and DiGiacomo-Cohen, M.L., 1998, The distribution of surficial sediments in New Haven Harbor, Connecticut, and the New Haven Dumping Ground, north-central Long Island Sound: U.S. Geological Survey Open-File Report 98-217, 27 p. [texture: 87]
Reid, R.N., O=Reilly, J.E., and Zdanowicz, V.S. (Eds.), 1982, Contaminants in New York Bight and Long Island Sound - sediments and demersal species, and contaminant effects on benthos, summer 1980: National Oceanographic and atmospheric Administration technical memorandum NMFS-F/NEC-16, 84 p. [texture: 10]
Savard, W.L., The sediments of Block Island Sound: Unpublished Master=s Thesis, University of Rhode Island, Kingston, R.I., 67 p. [texture: 39]
Tolderlund, D.S., 1975, Ecology study of the Thames River estuary, Connecticut, in the vicinity of the U.S. Coast Guard Academy: U.S. Coast Guard, RDCGA Report No. 575, 135 p. [texture: 34]
U.S. Army Corps of Engineers, 1977, Maintenance dredging at Mianus River, Greenwich, Connecticut: Environmental Impact Statement, Department of the Army, New England Division, Corps of Engineers, 50 p. [texture: 5]
U.S. Army Corps of Engineers, 1980, Federal Projects within Long Island Sound: Environmental Atlas of New England channel and harbor sediments, v. 1, Department of the Army, Corps of Engineers, p.314. [texture: 95]
U.S. Army Corps of Engineers, 1982, Black Rock Harbor - Cedar Creek Federal Navigational Channel, Bridgeport, Connecticut: Environmental Assessment, Department of the Army, New England Division, 44 p. [texture: 17]
U.S. Army Corps of Engineers, 1992, New York District Navigation Projects: Department of the Army, Corps of Engineers, New York District, 88 p. [texture: 55]
U.S. Environmental Protection Agency, 1996, Environmental Monitoring and Assessment Program Web Site, http://www.epa.gov/emap. [texture: 64]
U.S. Environental Protection Agancy-region 2, 1996, Sediment quality of the N.Y./N.J. Harbor, 1993-1994: R-EMAP Data Disk, Environmental services Division, Edison, New Jersey. [texture: 28]
Unpublished data acquired from the Marine Environmental Sciences section of Science Applications International and focused primarily around disposal sites. [34]
Unpublished data generated in the Sedimentation Laboratory at the Woods Hole Field Center, Coastal and Marine Geology Program, U.S. Geological Survey, Woods Hole, MA 02543 [texture: 774; organic carbon:432]
Wakeland, M.E., 1977, Provenance and dispersal patterns of fine-grained sediments in Long Island Sound: Dissertation, University of Connecticut, Storrs, CT, 269 p. [texture: 97]
Waterman, Ernest, and Demos, C.J, 1987, Maintenance dredging at Branford harbor, Connecticut: Environmental Assessment, Department of the Army, New England Division, Corps of Engineers, 27 p. [texture: 4]
Williams, S.J., 1981, Sand resources and geological character of Long Island Sound: Coastal Engineering Research Center, U.S. Army Corps of Engineers, Technical Paper No. 81-3, 65 p. [texture: 73]
An integral part of any functioning database is the dictionary that explains the structure and content of the database. It contains an index and definitions of the parameters measured and lists the fields which record and qualify those parameters. Extracting data from the database is facilitated by reference to this document because it provides a means to keep track of abbreviations and the sediment fields names.
Short Field Name | Full-Length Field Name | Field Description
SEQUENCE_# | Local row number | Sequential identification number, generated by the database (Excel) as the data were entered; gaps in these sequential numbers are present
USGS DB_ID | USGS unique sample identifier | Unique identification number (consisting of 2 characters and 3 numerics) generated in the sedimentation laboratory of the USGS's Woods Hole Field Center for the Atlantic Margin Texture Database
FIELD_ID | Field identifier | Sample name or number as assigned in the field
REQUESTER | Requester | Name of Principle Investigator or designee requesting analysis from lab
PROJ_NAME | Project name | Project under which samples were taken, or data generated (i.e. NOS Digital Database); sometimes indicates more specific area
SOURCE | Source reference | Bibliographic reference in which the data were originally published, or the organization that produced the unpublished data.
AREA | Area | General geographic area (general enough to easily locate on a state map )
LATITUDE | Latitude | Latitude in decimal-degrees (south latitudes are depicted by negative values)
LONGITUDE | Longitude | Longitude in decimal-degrees (west longitudes are depicted by negative values)
DEPTH (m) | Depth or sounding in meters | Measured depth of water overlying sediment at sample time, not corrected for tides, in meters
T_DEPTH | Top depth | Top depth of the sample below the sediment-water interface, in cm
B_DEPTH | Bottom depth | Bottom depth of the sample below the sediment-water interface, in cm
YEAR | Year | Calender year sample collected/analyzed
SMPLNG_DEV | Sampling device | Device used to collect the sample
SIZE_TECH | Size analysis techniques | General description of the particle-size analysis techniques used
LITHOLOGY | Lithology | General lithologic description
SED_CLASS | Classification | Sediment description based on a rigorous defination
CLASS_SYS | Classification system | Description of the system used for classification
CLASS_CODE | Classification code | Classification code number (from NOS Digital Database)
GRAVEL_PCT | Gravel | Gravel content in percent dry weight of the sample (particles with nominal diameters greater than 2 mm; -1
phi and larger)SAND_PCT | Sand | Sand content in percent dry weight of the sample (particles with nominal diameters less than 2 mm, but greater than or equal to 0.0625 mm ; 0 phi through 4 phi)
SILT_PCT | Silt | Silt content in percent dry weight of the sample (particles with nominal diameters less than 0.0625 mm, but greater than or equal to 0.004 mm; 5
phi through 8 phi, inclusive)CLAY_PCT | Clay | Clay content in percent dry weight of the sample (particles with nominal diameters less than 0.004 mm; 9
phi and smaller)FINES_SIL | Fines (sIlt + clay or mud) | Percent dry weight of the sample reported in both the silt and clay fractions (i.e. silt plus clay)
MEDIAN | Median | Middle point in the grain size distribution in phi units
MEAN | Mean | Average value in the grain size distribution in phi units
STDEV_SORT | Standard deviation (sorting) | Standard deviation (root mean square of the deviations) of the grain size distribution in phi units
SKEWNESS | Skewness | Skewness (deviation from symmetrical form) of the grain size distribution in phi units
KURTOSIS | Kurtosis | Kurtosis (degree of curvature near the mode) of the grain size distribution in phi units
MODE_1_CLA | Mode 1 class | First mode (particle size that occurs the most number of times) in phi units
MODE_1_STR | Mode 1 strength | Modal strength of the first mode in percent
MODE_2_CLA | Mode 2 class | Second mode in phi units
MODE_2_STR | Mode 2 strength | Modal strength of the second mode in percent
MODE_3_CLA | Mode 3 class | Third mode in phi units
MODE_3_STR | Mode 3 strength | Modal strength of the third mode in percent
NO_OF_MOD | No. of modes | Number of modes
PHI_STEP | Phi step | Phi interval used in analysis (e..g. full phi, half phi)
FROM_PHI | From phi | Largest particle size measured, in phi units
TO_PHI | To phi | Smallest particle size measured, in phi units
PHI-5 | -5 Phi | Weight percent of the sample in the -5 phi fraction (nominal diameter of particles greater than or equal to 32 mm, but less than 64 mm); very coarse pebbles
PHI-4 | -4 Phi | Weight percent of the sample in the -4 phi fraction (nominal diameter of particles greater than or equal to 16 mm, but less than 32 mm; coarse pebbles
PHI-3 | -3 Phi | Weight percent of the sample in the -3 phi fraction (nominal diameter of particles greater than or equal to 8 mm, but less than 16 mm); medium pebbles
PHI-2 | -2 Phi | Weight percent of the sample in the -2 phi fraction (nominal diameter of particles greater than or equal to 4 mm, but less than 8 mm); fine pebbles
PHI-1 | -1 Phi | Weight percent of the sample in the -1 phi fraction (nominal diameter of particles greater than or equal to 2 mm, but less than 4 mm); very fine pebbles (granules)
PHI_0 | 0 Phi | Weight percent of the sample in the 0 phi fraction (nominal diameters of particles greater than or equal to 1 mm, but less than 2 mm); very coarse sand
PHI_1 | 1 Phi | Weight percent of the sample in the 1 phi fraction (nominal diameter of particles greater than or equal to 0.5 mm, but less than 1 mm); coarse sand
PHI_2 | 2 Phi | Weight percent of the sample in the 2 phi fraction (nominal diameter of particles greater than or equal to 0.25 mm, but less than 0.5 mm); medium sand
PHI_3 | 3 Phi | Weight percent of the sample in the 3 phi fraction (nominal diameter of particles greater than or equal to 0.125 mm, but less than 0.25 mm); fine sand
PHI_4 | 4 Phi | Weight percent of the sample in the 4 phi fraction (nominal diameters of particles greater than or equal to .0625 mm, but less than 0.125 mm); very fine sand
PHI_5 | 5 Phi | Weight percent of the sample in the 5 phi fraction (nominal diameter of particles greater than or equal to 0.031 mm, but less than 0.0625 mm); coarse silt
PHI_6 | 6 Phi | Weight percent of the sample in the 6 phi fraction (nominal diameter of particles greater than or equal to 0.016 mm, but less than 0.031 mm); medium silt
PHI_7 | 7 Phi | Weight percent of the sample in the 7 phi fraction (nominal diameter of particles greater than or equal to 0.008 mm, but less than 0.016 mm); fine silt
PHI_8 | 8 Phi | Weight percent of the sample in the 8 phi fraction (nominal diameter of particles greater than or equal to 0.004 mm, but less than 0.008 mm); very fine silt
PHI_9 | 9 Phi | Weight percent of the sample in the 9 phi fraction (nominal diameter of particles greater than or equal to 0.002 mm, but less than 0.004 mm); clay
PHI_10 | 10 Phi | Weight percent of the sample in the 10 phi fraction (nominal diameter of particles greater than or equal to 0.001 mm, but less than 0.002 mm); clay
PHI_11 | 11 Phi | Weight percent of the sample in the 11 phi fraction (nominal diameter of particles greater than or equal to 0.5 mm, but less than 0.001 mm
CFP11 | Cfp11 | Cumulative frequency percent of the 11 phi fraction and coarser (less than 0.001 mm)
CFP10 | Cfp10 | Cumulative frequency percent of the 10 phi
fraction and coarser (less than 0.002 mm)CFP09 | Cfp09 | Cumulative frequency percent of the 9 phi fraction and coarser (less than 0.004 mm)
CFP08 | Cfp08 | Cumulative frequency percent of the 8 phi fraction and coarser (less than 0.008 mm)
CFP07 | Cfp07 | Cumulative frequency percent of the 7 phi fraction and coarser (less than 0.0016 mm)
CFP06 | Cfp06 | Cumulative frequency percent of the 6 phi fraction and coarser (less than 0.031 mm)
CFP05 | Cfp05 | Cumulative frequency percent of the 5 phi fraction and coarser (less than 0.062 mm)
CFP04 | Cfp04 | Cumulative frequency percent of the 4 phi fraction and coarser (less than 0.125 mm)
CFP03 | Cfp03 | Cumulative frequency percent of the 3 phi fraction and coarser (less than 0.250 mm)
CFP02 | Cfp02 | Cumulative frequency percent of the 2 phi fraction and coarser (less than 0.5 mm)
CFP01 | Cfp01 | Cumulative frequency percent of the 1 phi fraction and coarser (less than 0.1 mm)
CFP00 | Cfp00 | Cumulative frequency percent of the 0 phi fraction and coarser (less than 2 mm)
CFPM1 | Cfpm1 | Cumulative frequency percent of the -1 phi fraction and coarser (less than 4 mm)
CFPM2 | Cfpm2 | Cumulative frequency percent of the -2 phi fraction and coarser (less than 8 mm)
CFPM3 | Cfpm3 | Cumulative frequency percent -3 phi fraction and coarser (less than 16 mm)
CFPM4 | Cfpm4 | Cumulative frequency percent -4 phi fraction and coarser (less than 32 mm)
CFPM5 | Cfpm5 | Cumulative frequency percent -5 phi fraction and coarser (entire distribution is usually less than 64 mm)
ANALYST | Analyst | Name(usually first initial and last name) of person who performed the grain size or physical properties analysis
CHN ANAL | CHN analysis techniques | Description of the techniques used for total organic carbon, hydrogen, and (or) nitrogen
TOC_UNCOR | Uncorrected total organic carbon | Total organic carbon content in percent dry weight of the bulk sample, uncorrected for salt content
H_UNCOR | Uncorrected hydrogen | Hydrogen content in percent dry weight of the bulk sample, uncorrected for salt content
N_UNCOR | Uncorrected nitrogen | Nitrogen content in percent dry weight of the bulk sample, uncorrected for salt content
C/N | Carbon/nitrogen ratio | Molar organic carbon/nitrogen ratio of the bulk dried sediment
TOC_COR | Corrected total organic carbon | Total organic carbon content in percent dry weight ofthe bulk sample, corrected for salt content
H_COR | Corrected hydrogen | Hydrogen content in percent dry weight of the bulk sample, corrected for salt
N_COR | Corrected nitrogen | Nitrogen content in percent dry weight of the bulk sample, corrected for salt
COMMENTS | Comments on analyses | Any further information about sediment analysis for all or specific parameters in this table
[an error occurred while processing this directive]