BENTHIC HABITATS IN LONG ISLAND SOUND
There are a number of physical and chemical factors which are important determinants of habitat for benthic organisms. Based on many studies the most important of these for any particular geographic location include depth, sediment type, hydrodynamics and salinity (e.g. Rhoads 1974, Boesch 1977, Jumars and Nowell 1984). These are primary factors and they interact to affect other characteristics such as temperature, sediment texture and surface features, sediment organic content and how prone an area might be to disturbances such as storms. Thus, benthic habitats can be defined by a suite of multifaceted and interacting factors.
Perhaps the most basic of these, especially with respect to soft-sediment communities, is sediment grain-size. The initial focus then of determining benthic habitat characteristics in LIS was to assess information on sediment grain-size distributions in LIS and to develop GIS coverages which depicted this information and could be used for subsequent analyses. Based on this assessment, we adopted a standard sediment distribution in order to conduct analyses relative to information on benthic communities. In addition to sediment grain-size, sediment texture and surface characteristics are also important habitat determinants for benthic organisms. This type of information can be obtained on small spatial scales by in-situ observations by divers and from video and photographic records and on larger scales from side scan sonar imagery. Information from previously collected side scan information was also assessed and compared with sediment grain-size data in order to show how these types of data might be used in concert to develop habitat maps for LIS. Details of the analyses are given below. Information on the development of the GIS coverages shown is given in Chapter 8 of this CD-ROM.
A large number of studies have focused on the marine geology of LIS (Lewis and Coffin 1985; Lewis 1991, Chapters 1 and 2 of this CD-ROM), including sediment grain-size distributions (e.g. McCrone 1966; Akpati 1974, Williams 1981; Friedrich et al. 1986, Chapter 3 of this CD-ROM). Sediment distribution information has also been collected during studies of the benthic ecology of LIS (e.g. Ried at al. 1979, and see below). Among these, the study by Freidrich et al. (1986) was initially assessed because it reviewed and incorporated information from previous studies to develop a sediment grain-size distribution map (Figure 4 in Friedrich et al. 1986). This map was digitized as part of this project and it depicts the spatial distribution of six sediment types (Figure 1, Table 1). This coverages will be referred to as LISSED. Based on this coverage, the most prevalent types of sediments in LIS, by percent area, are silt (31 %), fine sand (30 %) and coarse sand (20%). The remaining area (19%) is comprised of medium sand, gravelly sand and gravel. The spatial variability in the distribution of these sediment types differs among the eastern, central and western portions of the Sound (Figure 1). In the eastern basin, from the Race to the Mattituck Sill, sediments vary more spatially and are comprised of generally coarser material. In the central basin, from the Mattituck Sill to Stratford Shoal, sediments are comprised of primarily two large areas of silt and fine sand, with some coarser sediments along the north and south shores of the Sound. In the eastern portion of LIS, from Stratford Shoals to the Narrows, sediment types and their distribution are again more variable. Although the area is, like the central basin, comprised of mainly silt and fine sand, there are significant areas of medium and coarse sand.
The general distribution of sediment types shown in Figure 1 agrees fairly well with previously available sediment distribution maps. The estimates of areal coverage of the sediment types agree as well. For example, if the fine sand and silt categories are grouped and considered as mud, then their areal coverage, 61%, is in agreement with the estimate of 56% made by Bokuniewicz and Gordon (1980). However, in order to provide some measure of the potential variability in what we perceive to be the distribution of sediment types in the Sound we also examined and developed GIS coverages for several other sediment distribution maps. These included the NOAA New Haven Bathymetric Fishing Map (NOAA, 1989), a map developed by Reid et al. (1979) based on survey work conducted between 1972 and 1973, and a map that was developed by this project based on qualitative sediment composition data collected by Pellegrino and Hubbard (1983). These are shown in Figures 2, 3 and 4, respectively.
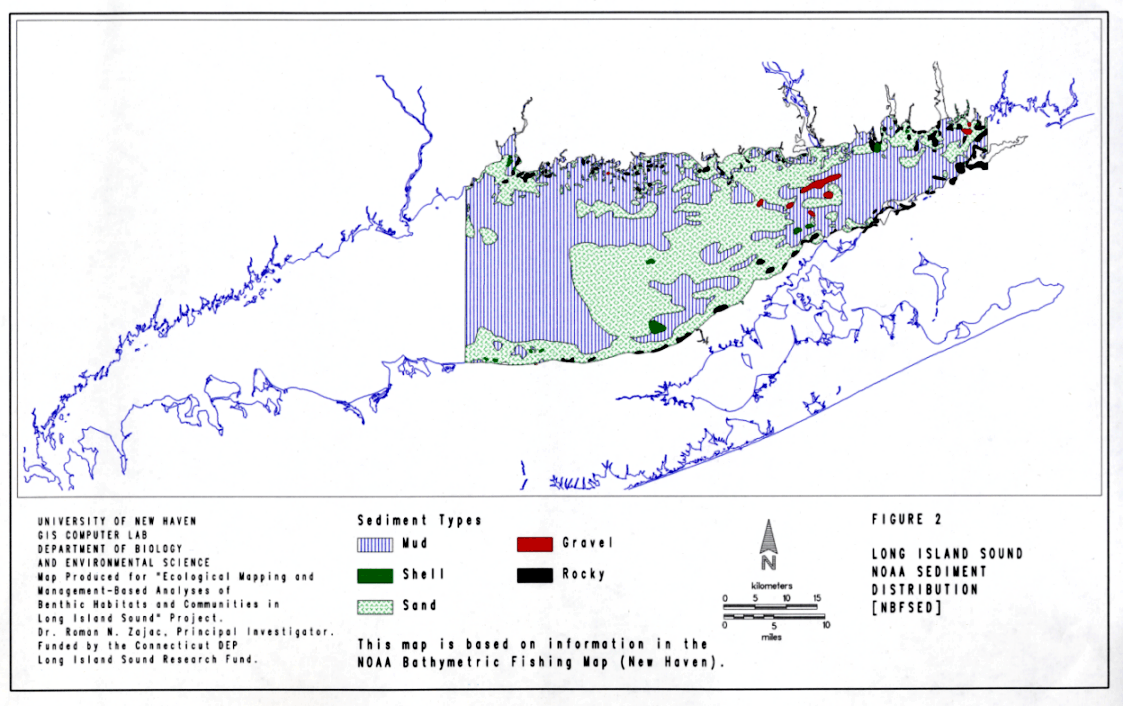
The NOAA Bathymetric Fishing Map depicts the distribution of five sediment types in the eastern portion of LIS (Figure 2, Table 1). Note that one of the sediment types is shell, which actually is a bottom type characterization as opposed to sediment grain-size. The map covers approximately 57% of the Sound. This coverage is referred to as NBFSED. The map is based on surveys conducted between 1872 and 1971, with the most up-to-date information used at the time to compile the map; the information shown is from the predominant sediment in the samples (Carl Fefe, National Ocean Service, personal communication). Based on this map, the largest proportion of the area is comprised of mud (55%) and sand (41%) with only 4% of the area comprised of gravel, shell and rocky substrates.
In comparison to the LISSED map (Figure 1), there is general agreement in the western portion of the NBFSED map (Figure 2), between the area defined by New Haven Harbor and the Mattituck Sill, if we group sand and mud in the NBFSED and silt and fine sand in the LISSED map, respectively. In the eastern basin, however, there are significant differences between the two maps. For example, NBFSED shows several large areas of mud west of the race and north of the south shore of the Sound. In contrast, LISSED characterizes these areas as being comprised by coarser sediments. These differences may be due to extrapolating bottom types from small sets of samples in each case, which in a variable and dynamic area such as the eastern basin may result in errors to a greater extent than in the central and western basins. With respect to characterizing habitats for benthic communities, it suggests that large-scale variation in sediment type, on the order of km2, may be more significant in the eastern basin than in other portions of the Sound.
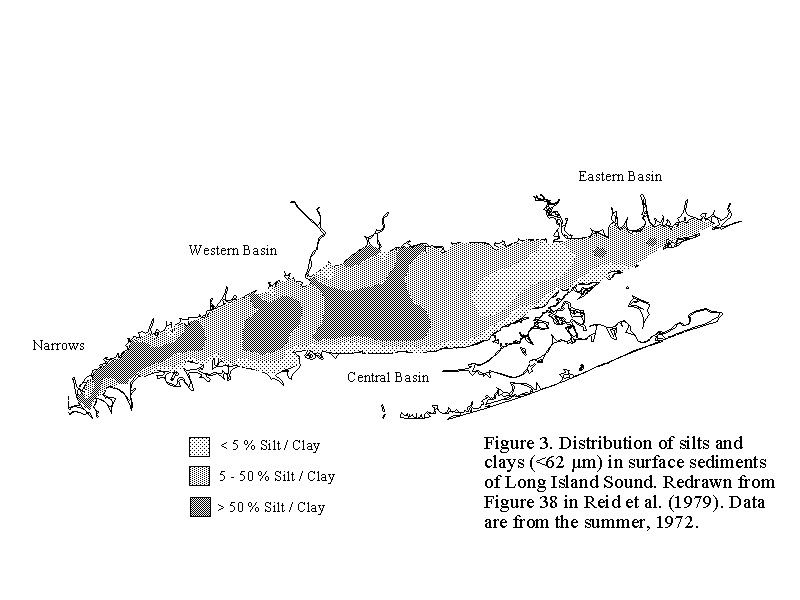
Reid et al. (1979) developed a sediment map depicting the distribution of silts and clays (< 62 mm grain-size) in LIS. This particular map (Figure 3) focused on differences in one sediment fraction and used a wide range (5 - 50%) for one of the categories. However, it agrees with the general characteristics depicted in Figures 1 and 2 for the central and western portions of the sound, such as the presence of large areas of silts. The most loss of detail occurs in the western and eastern basins, although the large tongue of sand extending southwest from the mouth of the Connecticut River shown in NBFSED (Figure 2), and depicted as coarse and medium sand in LISSED (Figure 1) is shown in the Reid et al. (1977) map (Figure 3) as an area of generally < 5% silt-clay.
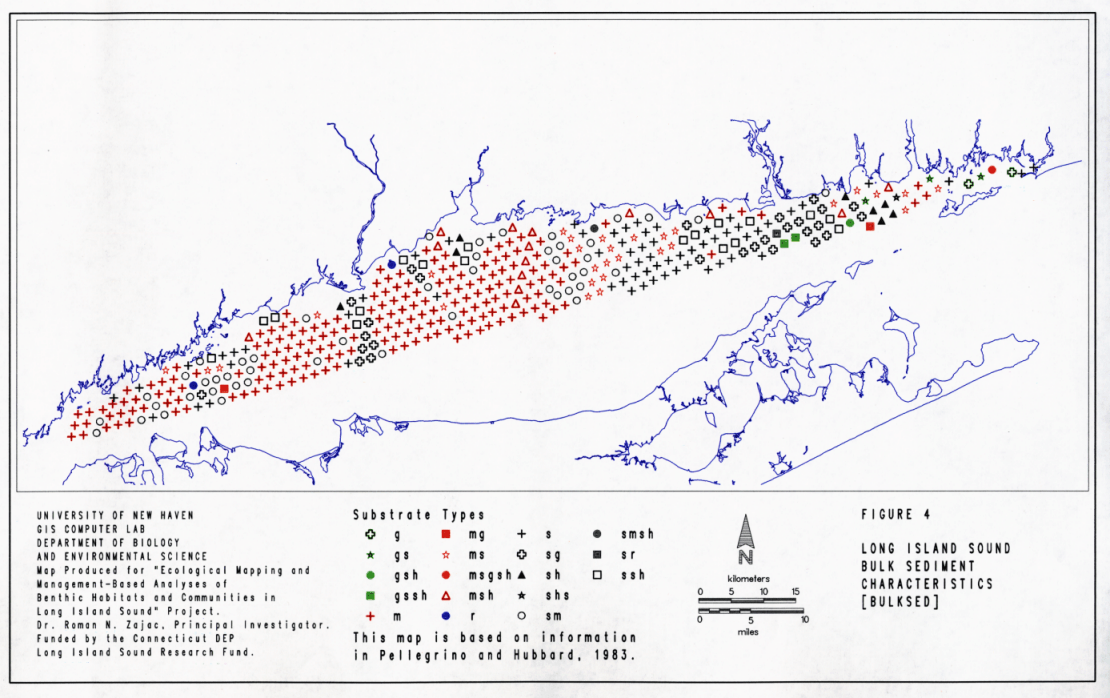
The sediment distributions depicted above are based on sediment grain-size analyses and interpretations that depict either the most predominant size-fraction in a sample (Figures 1 & 2) or a specific size-fraction (Figure 3). Another approach is to qualitatively characterize the sediments based on their general bulk properties when they are collected. This type of characterization is depicted in a sediment map (Figure 4) developed from qualitative information collected on sediment properties during benthic community surveys conducted by Pellegrino & Hubbard (1983). Sediment type was visually examined by Pellegrino and Hubbard (1983) and placed into general categories of rock, gravel, sand, mud, shell and combinations thereof (Table 1). This coverage (BULKSED) is based on observations at 413 sampling points (as such it is a point coverage as opposed to the polygon coverages depicted in LISSED and NBFSED), covering the northern section of the Sound in Connecticut waters (Figure 4, Table 1). The predominant sediment types were mud (45% of the points), followed by sand (15%) and sandy mud (11%). This agrees with the values presented above. The general distribution of sediment types in Figure 4 also corresponds to those given in the other sediment distribution maps.
Albeit qualitative in nature, given the high spatial resolution and the greater number of categories designated, the BULKSED map provides pertinent habitat information that is lacking in the two coverages presented above. Specifically this includes information on the variability of sediment types and finer spatial resolution of their distribution. With respect to bottom type variability, there are 18 categories of sediments depicted (Figure 4, Table 1), and these different bottom types may have significant effects on the distribution of benthic communities. For example, eight of the categories include shell and comprise about 12 % of the stations. The inclusion of shell in the sediments may alter community structure providing a more heterogenous bottom for a greater variety of species in any specific location.
Regarding the spatial distribution of sediment types, the changes in sediment type in Figures 1 - 3 are shown as distinct boundaries, when in fact there may be gradual transitions in sediment type over large spatial scales. Transitions (or ecotones) between different habitats may be important ecologically (Gosz 1993). The BULKSED map (Figure 4) provides some indication of the location and extent of transitions in sediment characteristics in LIS. For example, the large area of muds in the central basin gives way to sandy muds south of the Thimble Islands, then to muddy sand and finally to sands, roughly along the Mattituck Sill. Another interesting point that comes from comparing Figures 1 , 2, 3, & 4 is that while the others generally show the nearshore sediments to be fairly homogenous, the BULKSED map suggests that, in fact, these areas are quite heterogenous in terms of sediment characteristics. For example, along the Connecticut shore between Branford and Guilford, the area is shown as being comprised of coarse sand in the LISSED map (Figure 1), while the NBFSED map (Figure 2) and the BULKSED map (Figure 4) both suggest greater variation in bottom types. The NBFSED map shows the area being comprised of patches of sand and mud, whereas the BULKSED map shows that sediments include sandy mud with shell, mud, muddy sand, sand, sandy gravel, shell and sand with shell. This helps to explain why this area was depicted by Reid et al. (1977) as having a silt - clay content between 5 and 50 % (Figure 3), as each of these sediment types is likely to have different fractions of fine sediments.
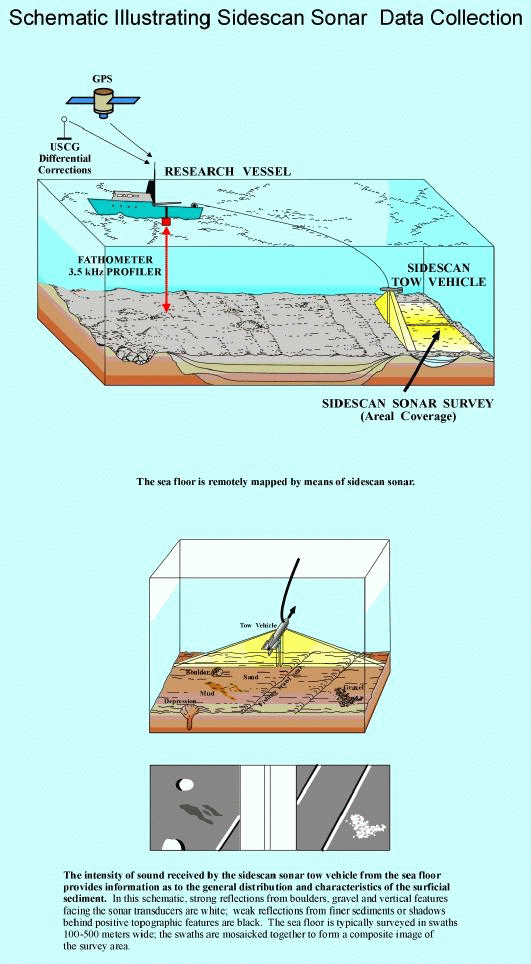
Seafloor characteristics are being increasingly investigated by sidescan sonar (e.g. Tucker 1966; Twichell et al. 1981; Knebel et al. 1982; Neff et al. 1988, Chapters 1 and 2 of this CD-ROM). Using acoustic signals, seafloor characteristics are visualized on a sonograph, as different surface sediments and sediment features give different acoustic returns. These differences can then be interpreted based on direct observation of features, such as boulders and sand waves, and the known acoustic reflectance properties of different sediment types. Briefly, side scan data is collected at various spatial resolutions depending on the intensity of the acoustic signal used and the spacing between track lines (i.e. the path of the ship along which the "fish," which contains the transducers generating the acoustic signal, is towed). When the track lines are closely spaced such that there is an overlap in the individual acoustic records then such records can be joined to form a continuous image of some portion of the sea floor. This is referred to as a side scan mosaic. In other applications (e.g. Neff et al. 1988, Phillips et al. 1990), the side scan tracks are further apart and do not overlap. In this case the structure of the overall study area is determined by interpolating the spatial extent of the seafloor features between the track lines.
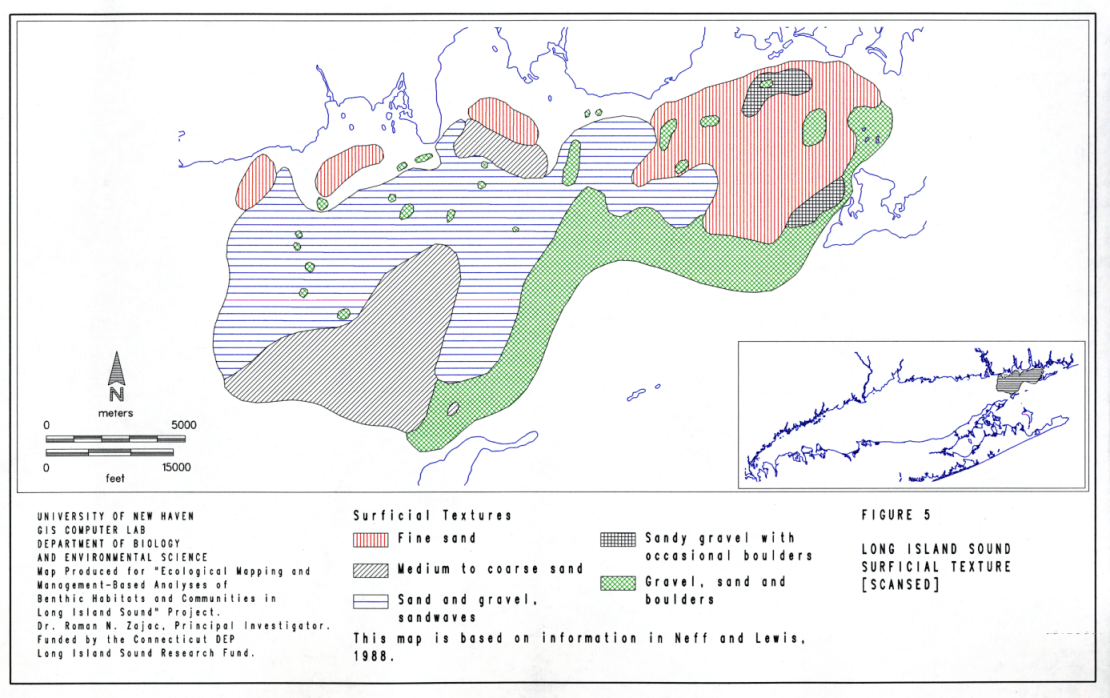
One of the main benefits of side scan sonar is that it allows visualization of a large part of the seafloor as compared to individual samples cores, thus allowing one to determine the spatial extent and specific positions of seafloor characteristics and transitions between them. This can be invaluable data for researchers interested in the physical, chemical and biological dynamics of the seafloor. To demonstrate how this type of information might be used to define benthic habitats both independently and in conjunction with other types of data, a side scan map that was developed for the eastern portion of LIS by Neff et al. (1988) was digitized and entered into the benthic GIS. This coverage is referred to as SCANSED. The SCANSED map provides information on sediment texture and topography for a 183 km2 portion of the eastern basin of LIS (Figure 5, Table 1). Five bottom types were discerned. The most prevalent bottom type was sand and gravel with sandwaves (39%), followed by approximately 20% each of fine sand, medium to coarse sand and a mixed bottom of gravel, sand and boulders. Comparison to the other sediment coverages indicated that there is general agreement with the LISSED map (Figure 1), which depicts this area as gravelly sand, medium sand and coarse sand. However, the NBFSED map (Figure 2) shows it be a combination of sand and mud. In contrast, the BULKSED map indicates the area is variable, but comprised of mud, muddy sands, shell, shelly sand, gravelly sand and muddy gravel (Figure 4).
How can these sources of information be used to define benthic habitats in LIS? Each of the studies discussed above, and the coverages developed for the benthic GIS, provides different information to various degrees. Sediment maps provide information on granulometry, side scan maps information on large surface features and the spatial extent of different bottom types, while qualitative information such as given in Figure 4 provides information that the latter two methods may not detect or report (e.g. the mix of sediment types in the sample). All of these characteristics are pertinent to defining the variety and spatial extent of benthic habitats in the Sound. By combining the information in these coverages, initial benthic habitat maps can be generated. With the addition of other types of data (e.g. bathymetry, slope of the bottom, oxygen level, residual circulation), increasingly detailed habitat maps can be generated for any particular portion of the Sound.
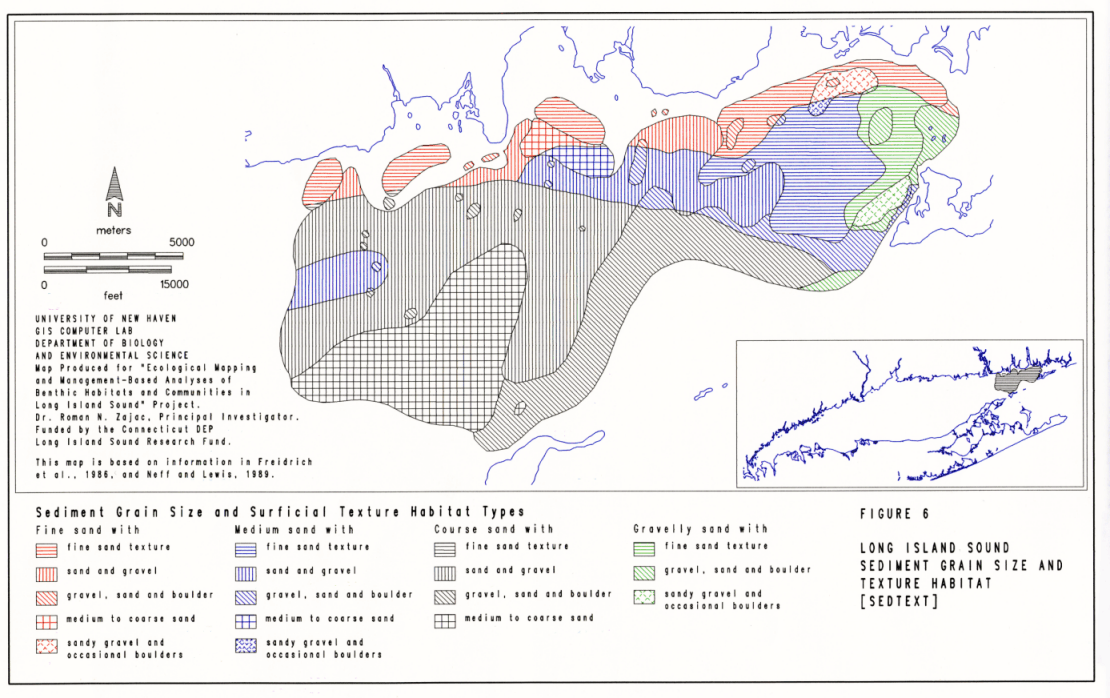
As an example of this approach, the LISSED and SCANSED maps (Figures 1 and 5) were combined, using GIS overlay techniques, to determine the distribution of benthic habitats in the area defined by the spatial extent of the SCANSED map. The LISSED and SCANSED maps provide information on six and five bottom type categories, respectively. Combined, 16 possible bottom types were generated, that now incorporate information on two important benthic habitat components, sediment grain-size and seafloor topography (Figure 6). Benthic organisms respond to both of these factors at varying spatial scales. This coverage, SEDTEXT (Figure 6), provides more detailed information on the spatial dispersion of habitats and other features such as transition zones in this area of LIS. For example, on the SCANSED map, the area just south of the mouth of the Thames River was characterized as primarily fine sands with patches of sandy gravel, gravel and boulders based on sonograms. In the LISSED map this area grades from fine sands at the mouth of the Thames River to medium sand moving south towards the race, and gravelly sand to the west towards Fisher's Island Sound. Combining the two sources of information indicates that the area is more heterogenous than either coverage alone indicates. The fine sands interpreted by Neff et al. (1988) may grade into medium sands to the south and gravels to the east. The designation of the fine and medium sand areas as both having fine sand texture indicates a bottom that, apart from the patches of boulders that occur, is mostly devoid of meso-scale features (e.g. on the order tens of m2) such as sand waves and gravel beds. Likewise, more detail is provided for the large area on the SCANSED that is designated as sand and gravel and sandwaves, with a transition from east to west of fine to medium to coarse sands (Figures 5 and 6).
A more general approach to generating habitat maps for specific areas of the Sound, using the information provided in the GIS coverages developed during this project and information from other sources (Table 2), is shown in Figure 7. Ideally, maps depicting seafloor characteristics based on side scan sonar investigations are used as the starting point for developing more detailed habitat assessments. Side scan sonar provides the most accurate information on the location of different bottom types and transition zones among them, as well as information on the presence of natural topographic features such as sandwaves, boulder fields and outcrops and those created by human activities such as shipping channels and trawling scours. Based on their acoustic reflectivity, specific areas on the sonogram can be characterized as being comprised of certain types of sediments (e.g. sands, muds, etc.). At this point, information on the side scan map can be augmented / ground-truthed by overlaying information from the other coverages. The LISSED and NBFSED maps provide information on sediment grain-size, thus giving insights as to the predominant sediment fraction in areas characterized by reflectivity, whilst qualitative information on combined sediment characteristics can be obtained from the BULKSED coverage. The resulting habitat map can then be used to guide further investigations. This may include subsequent sampling to obtain additional habitat information, such as sediment organic content, small-scale topographic features as revealed by photography and/or video imaging, etc. This information can then be combined to form an initial habitat map, and as information from other sources is collected, a detailed habitat map can emerge.
Implications of Recent Mapping Efforts in Long Island Sound
The review presented above is primarily based on work that was done prior to the side scan and related geologic and hydrologic studies presented in this CD-ROM. As such it provides a historical context for the continued development of habitat mapping, and data for particular types of sedimentary habitats that can be evaluated in light of this new information. There is now in place a significant amount of information is available on sea floor characteristics in LIS. It is also apparent that the best framework for habitat mapping, analysis, and management is that based on sidescan-sonar imagery. Chapters 1 and 2 of this CD-ROM is an attempt to provide this framework. These studies have outlined and mapped the dominant bottom sedimentary environments in the Sound based on regional and continuous-coverage sets of sidescan sonographs, supplemented by grab samples and video camera observations obtained at strategic locations. The interpretations of sedimentary environments also have incorporated a wealth of available marine geologic data including seismic-reflection profiles, previous geologic maps, regional maps of bottom sediment types, a regional suite of vibracore samples, the detailed bathymetry, and modeled tidal-, wind-, and wave-produced bottom currents (see also Knebel et al., 1999).
The new data from the regional and detailed surveys presented in Chapters 1 and 2 provide a basis for exploring the characteristics and variability of benthic habitats throughout the Sound. The goal of benthic habitat mapping is to define the location and extent of environmental conditions that are amenable to the life histories and life modes of varied infauna and epifauna. Benthic habitats should be defined by the physical and chemical characteristics that form the sedimentary elements of the Long Island Sound sea floor landscape and by the biotic conditions and modifiactions in those elements via organisms sediment interactions. While on large-scales, the distribution of benthic habitats and sedimentary environments are largely controlled by the same geologic and oceanographic conditions such as sea floor substrate, bottom-sediment type, and bottom-current strength, at meso- and smaller spatial scales the interplay between physical, chemical and biological processes may be quite complex.
The next phase of habitat mapping then is to integrate these physio-chemical and biotic processes into an ecological framework for defining habitat. The data presented in this CD-ROM provide the underpinnings for such detailed habitat studies at smaller spatial scales within the Sound.
The sedimentary maps and data contained in this CD-ROM also comprise the framework for the extended development of a Benthic GIS. This GIS can incorporate the new data on regional and detailed sedimentary environments, and be used to produce preliminary habitat maps for the entire Sound. In turn, the general benthic habitat maps could lead to more detailed assessments. For example, a preliminary analysis of the relationship between the abundance and dispersion of finfish stocks and bottom habitats in the Sound could be carried out by overlaying information on variables such as catch per unit effort of bottom feeding fish such as flounder and the population abundances of potential prey populations on the sedimentary maps. This type of research is currently underway and will hopefully provide meaningful tools for the management of natural resources in Long Island Sound.
[an error occurred while processing this directive]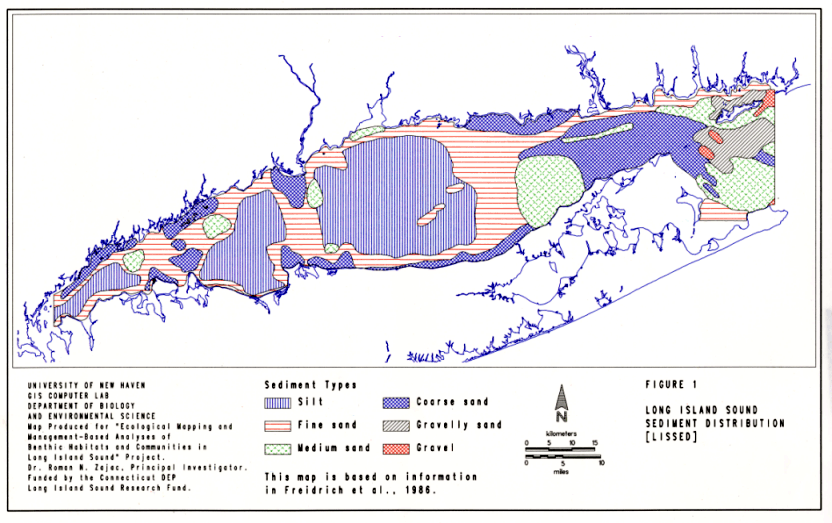