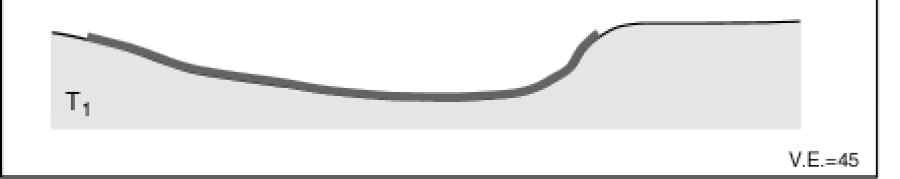
Figure 7B: A schematic diagram showing the changes in rippled scour depression width through time (T1, T2, T3, Tpresent) suggested by
the course-fine sediment stratigraphy in the cores shown
 |