|
Multibeam Bathymetric and Backscatter Maps of the
Upper Hudson Shelf Valley and Adjacent Shelf, Offshore of New York
 |
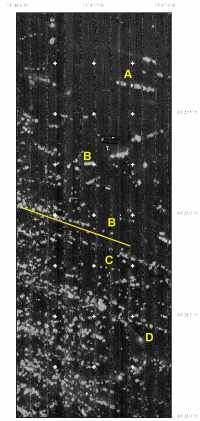 |
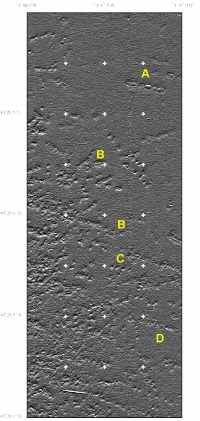
Figure 10. Bathymetric (left panel) and backscatter (right panel) signature of the ubiquitous features throughout the survey that are interpreted to be individual dumps of material (scale 1:12,500). In the shaded-relief image, the bathymetry was exaggerated 5 times and illuminated from an azimuth of 350° at an angle of 45°. The shaded-relief image was created from the data gridded at 3 m, the backscatter intensity from data gridded at 2 m. The backscatter intensity of the underlying material in this region of the survey area is low, and thus the features characterized by high-backscatter are clearly visible. Some of the individual features appear to be local highs (A), but most appear as depressions with a central mound in the middle of the depression (B), or as depressions (C). Some features appear as high backscatter, but have little signature in the bathymetry (D). Many of the features appear in linear patterns oriented approximately west-northwest.
|