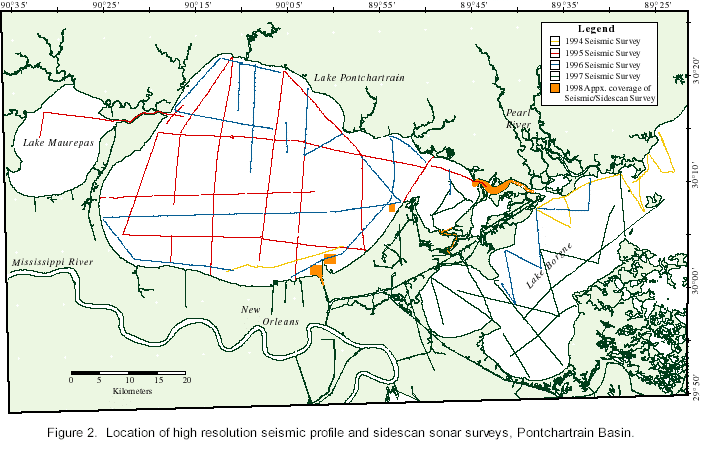
Geophysical Surveys (con't) Side Scan Sonar Surveys- Objectives and Accomplishments:
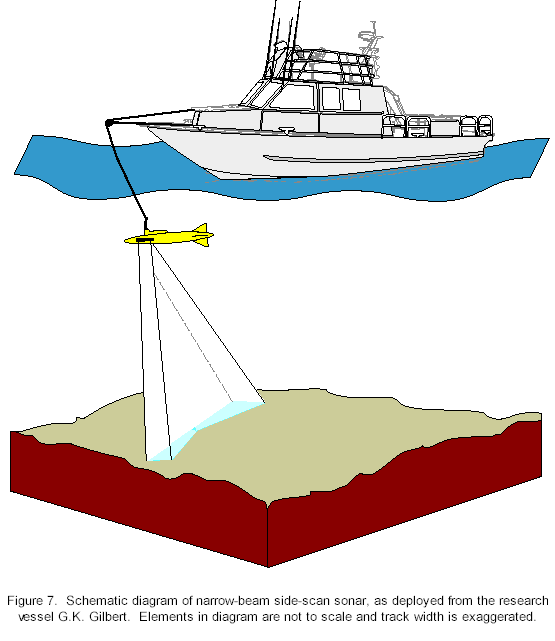
Through shipboard and post-processing, the return signal is filtered for noise and corrected for spatial and geometric variation. Signal strength is represented by pixel intensity and adjacent returns are geographically referenced into a mosaic to produce a two-dimensional image, similar to a photograph, of the sea floor. This spatial representation of the sea floor is a useful tool for identifying subregional geomorphologic features and sediment texture distribution. Man-made features such as dredge pits and dump sites are also commonly of appropriate dimension to be readily imaged by this technique. Like HRSP, side scan sonar image quality and resolution are dependant on a number of factors, including sea state, altitude of the tow fish above the bottom, noise (associated with the tow vessel, other vessels or the water column) and navigation/bathymetric resolution. Towing altitude is a major factor in this study. The areas surveyed in this project are typically not deep enough for an adequate side scan swath width. Altitudes should be roughly a tenth of swath; for a 100m swath the tow fish should be at an altitude of 10m above the sea floor. This depth would exclude most of the Lake Pontchartrain Basin. Thus for this study side scan sonar surveys were restricted primarily to the deeper approaches to Lake Pontchartrain (Rigolets and Chef Menteur) and to the dredge pits along the south shore, with water depths exceeding 18 meters.
The Side Scan Sonar surveys were conducted in response to the identification of the dredge pits and their potential as recent sediment traps, an undisturbed recepticle for contaminants associated with development along the south shore. In conjunction with bathymetry surveys acquired earlier and discussed below, the surveys were intended to delineate the dimensions of the dredge pits and to identify any internal structure to the sediments in and about the depressions. Methods: The side scan sonar system includes a EG&G towfish running at 100 Khz, controlled by a SEAMAP signal processor. The towfish is deployed approximately 5 feet below the surface with a transducer angle of about 10 degrees. Boat speed is maintained at about four knots. Acquisition software was the Elics Delph-Sonar system, running in real time on a Kontron Electronics IP Lite laptop computer. A 100 meter swath was being collected, with the digital data backed up on removable 1 Gigabyte hard disks. Navigation data was collected every 2 seconds using a PLGR (Rockwell) GPS receiver with Geolink mapping software. Bathymetry was collected using one E Sound 103 fathometer at 200 Khz and Fugawi acquisition software.
|
|||||||||||||||||