
Rock-fall Hazards in the Yosemite Valley
Open-File Report 98-467
by
Gerald F. Wieczorek, Meghan M. Morrissey, Giulio Iovine and Jonathan Godt
This report has not been reviewed for conformity with U.S. Geological Survey editorial standards or with the North American Stratigraphic Code. Any use of trade, product, or firm names is for descriptive purposes only and does not imply endorsement by the U.S. Government.
Abstract
This report with map shows the areas of highest rock-fall hazard in four selected parts of Yosemite Valley, California, defined by the National Park Service. Two specific levels of hazard are recognized and identified from rock falls ranging in size from individual boulders to moderate-sized events with volumes of 100,000 m3. These different levels of hazard are associated with areas within the base of the talus (red line in Plate 1) and those normally beyond the base of the talus which we refer to as the rock-fall shadow (yellow line in Plate 1). Rock falls of even greater size, exceeding 100,000 m3, referred to as rock avalanches, are a potential hazard, but the extent of this hazard is not easily defined. Rock avalanches are considered to be much less likely to occur because of the relatively few prehistoric rock-fall avalanche deposits that have been recognized in the Yosemite Valley. With the configuration of the steep valley walls and the relatively narrow valley, it should be noted that there are no absolutely safe or zero probability areas from large rock avalanches. This study has shown in map form where rock-fall hazard exists and has given general indication of the expected frequency of these events; however, the study does not quantify the probability at any specific location, nor evaluate the risk to people or facilities to such events.
Introduction
Rock falls and other associated forms of mass movement, such as rock slides, debris flows and rock avalanches, are natural processes that continue to shape Yosemite Valley. Subsequently in this report, unless specifically identified, we will use rock fall as a generic term referring not only to rock falls, in the strict sense, but also to rock slides, debris slides, debris flows, and rock avalanches. Rock falls were noted by the Native Americans. For example, their name for Rocky Point or the talus cone below Middle Brother, a frequent site of rock falls, was We-ack , understood to mean fallen rocks. Prehistoric rock avalanche deposits, such as those that blocked Tenaya Canyon and formed Mirror Lake, are recognized at several locations denoted in Plate 1. During historical time more than 400 rock falls have been documented; nine people have been killed by rock falls and many others injured (Wieczorek et al., 1992). Many trails, roads, and buildings have been destroyed or seriously damaged by rock falls. Rock falls may also trigger an airblast such as the one near Happy Isles in July of 1996 that killed one person, seriously injured several others, destroyed the snack bar, and damaged several bridges and the Happy Isles Nature Center (Snyder, 1996).
Most rock falls are associated with triggering events, such as earthquakes, rainstorms, or periods of warming producing a rapid melting of snow. The magnitude and proximity of the earthquake, intensity and duration of the rainfall, thickness of the snowpack, and the warming pattern, all influence the triggering of rock falls (Wieczorek and Jäger, 1996). However, some rock falls occur without a direct correlation to an obvious triggering event; these rock falls are probably due to processes associated with gradual stress release and exfoliation of the granitic rocks (Wieczorek et al., 1995).
Rock falls have left abundant deposits of talus around the base of almost all the walls of Yosemite Valley. Matthes (1930) mapped the extent of talus around the edge of the valley which, in some places, is estimated to be greater than 100 m thick (Wieczorek and Jäger, 1996). At some locations, such as below El Capitan (d on Plate 1), where large prehistoric rock avalanches have occurred, these deposits extend from the base of the wall about 425 m across the valley floor (Wieczorek et al., 1992).
Rock falls range in size from small individual blocks of less than 1 m3 to rock avalanches of several million cubic meters. Even a rapidly moving small boulder can cause serious injury to a person and considerable damage to vehicles or buildings. The frequency of different size rock falls has been determined from an analysis of historical rock falls (Figure 1)(Wieczorek et al., 1995). Many small rock falls are observed every year in the Yosemite Valley, many more small rock falls probably go unreported each year. Larger size rock falls occur less frequently. For example, the return period for rock-fall events with volumes equal or greater than the 1996 Happy Isles rock fall (approximately 30,000 m3) is about 11 years.
For land-use planning in Yosemite Valley, the National Park Service (NPS) requested the U.S. Geological Survey to assess the available information and to evaluate potential rock-fall hazard in four specific parts of the Yosemite Valley identified by NPS as: Yosemite Lodge, Campgrounds, Taft Toe, and Housekeeping Camp identified on Plate 1. In this report we did not evaluate the hazard from rock-fall induced airblasts or from rock avalanches.
Methodology
Field analysis of rock falls
In the field, we reexamined the limits of the rock-fall deposits that had been previously mapped (Wieczorek et al., 1992) and of the talus (Matthes, 1930). This effort concentrated on confirming the limit of rock-fall talus between individual rock-fall deposits. At most locations, large accumulations of blocks from rock falls made this limit easy to define; however, in some areas, this determination was slightly more difficult, particularly if vegetation or soil had buried the surface of older debris-flow deposits or if human modification had altered the area. The distinction between areas of debris-flow deposition and flood deposition was made on the basis of distribution and sorting of deposits aided by occasional exposures in channels. Recent or historical flooding can modify rock-fall deposits making identification difficult or confusing, such as within Upper Pines Campground. Distinction between rock-fall talus and moraine deposits was also problematical, but was limited to one small area near Tenaya Bridge. The base of talus is shown as a red line in Plate 1.
A second objective in the field was to identify individual boulders that extended beyond the base of the talus. These scattered outlying boulders or outliers illustrate a potential hazard in the vicinity of talus slopes (Evans and Hungr, 1993). Most rocks that break loose from the valley walls will stop moving within the talus; however, a few, larger individual boulders may travel further. The locations of outliers that we mapped are shown on Plate 1. The minimum shadow angle (Evans and Hungr, 1993) defines the angle extending horizontally from the apex of the talus slope to the farthest outlying boulder (Figure 2). Measurements and estimated sizes of some of the boulders are listed in Table 1. The largest outlier, found in Sunnyside Campground southwest of Yosemite Lodge, measured about 15 m long by 13 m wide by 9 m thick (estimated volume of about 1750 m3) and travelled about 60 m beyond the base of the talus.
Numerical studies of rock-fall hazards
Although computer programs have been developed which analytically model the travel of individual rock blocks, these programs require specific data on the size, shape, and location of potential rock falls and require additional assumptions. For example, the Colorado Rockfall Simulation Program (CRSP) (Pfeiffer et al, 1993) only models rock falls that travel in a straight line and does not accommodate boulders splitting upon impacts as they travel downslope. Jäger (1997) used measurements of boulder size distribution and shape, surface roughness and tangential coefficient parameters along the potential travel path, and incorporated a profile from a 30-m Digital Elevation Model in CRSP for modeling rock falls from near Union Point behind Old Yosemite Village. The data and assumptions necessary for using such computer analyses make it difficult to systematically apply and interpret the results for hazard assessment.
A simple empirical method for identifying the zone of rock-fall hazard beyond the talus utilizes the concept of a rock-fall shadow which defines the distance that individual rocks may occasionally travel (Hungr and Evans, 1988; Evans and Hungr, 1993) . The limit of the minimum shadow angle is used to define the rock-fall shadow where rare rock-fall events will stop. The method of Evans and Hungr (1993) is applicable for rock-fall events at the lower end of the size range or magnitude spectrum, referred to as a fragmental rockfall by Hungr and Evans (1988), which pose hazards near the base of talus slopes. Fragmental rock fall is the more or less independent movement of individual rocks, as opposed to the sliding or mass flow of coherent or broken rock typical of a rock avalanche. Although there is no well defined volume limit, Evans and Hungr (1993) have suggested that rock falls of less than 100,000 m3 be characterized as fragmental rock falls that can be considered to move as single blocks. We measured shadow angles using mapped locations of the boulders and the apex of the deposits identified by Wieczorek et al. (1992) and included on Plate 1. In the few places where we could view the top of the talus from the outlier, we measured the shadow angle directly and these compared well with computed values (Table 1).
The estimated volumes of five large prehistoric rock avalanches in Yosemite Valley listed in Table 2 and identified on Plate 1 exceed 100,000 m3 . In the field, these rock avalanche deposits show evidence of coherent mass movement and the limits of these deposits extend considerable distances beyond the rock-fall shadow, such as near Tenaya Bridge (b on Plate 1). The travel distance of these Yosemite rock avalanches as a function of volume is comparable with data from other worldwide rock avalanches from Li (1983) as shown in Figure 3 .
Field analysis of rock avalanches and debris flows
Scars on the valley walls identify where large chunks of rock have previously fallen, some of them large enough to be rock avalanches. Some of these scars, defined by the intersection of prevalent joint sets and exfoliation sheets, indicate a process of developing arches that eventually may collapse as large rock avalanches. For example, the rock walls above the Happy Isles Nature Center show several arch-like structures. Historically, small and moderate sized rock falls gradually retrogress and aid the development of larger arches. Although we cannot predict when or where rock avalanches will occur, their travel as indicated by prehistoric examples could extend beyond the base of the talus and rock-fall shadow. Methods, e.g. see Hungr (1995), are not yet sufficiently developed to accurately model the travel distance of large rock avalanches. As a consequence, like rock-fall induced airblasts, large rock avalanches must be acknowledged as potentially catastrophic, but relatively infrequent events.
Debris flows are capable of carrying large boulders and traveling large distances because of their supportive fluid matrix and can move at velocities up to 3 m/s or higher. Debris flows carrying boulders have previously damaged structures in Camp Curry. The farthest outlying boulders we observed may have been carried by debris flows. Certain other conditions could affect the travel of boulders. Rocks falling onto snow or ice can travel longer distances than they would be otherwise possible (Rapp, 1960). In addition, areas that have been recently burned can more easily generate debris flows during heavy rainfall (Cannon, 1997).
Results
From the sample of 25 outlying boulder locations, we determined a mean shadow angle of 26.1°, a median of 26.6° , and a standard deviation of 2.3°. We selected a minimum shadow angle of 22°, because, within the accuracy of our measurements, this value agreed with our minimum measurement of 21.6° and was within two standard deviations of the mean. This value for the minimum shadow angle compares well with values cited by Evans and Hungr (1993), particularly for areas with debris flows. Selecting a higher shadow angle would move the yellow line on Plate 1 closer to the valley walls.
Plate 1 shows the two hazard zones within the four study areas (black line). The red line defines the extent of the talus and the yellow line defines the distance of the rock-fall shadow. The rock-fall shadow was determined by a procedure based on the location of the apex of the talus from Wieczorek et al. (1992) and a minimum shadow angle of 22°. In a few locations, the shadow line was upslope of the talus line, most conspicuously where debris-flow deposits extended downslope farther into the valley with a degree of steepness less than the shadow angle and where large prehistoric rock avalanche deposits extend far into the valley.
Areas within either the talus (red line) or the rock-fall shadow (yellow) are potentially hazardous, although the degree of hazard depends upon the period of time that might elapse between return events in either respective area. Within most talus, rock falls could be expected almost yearly to every several decades. For rocks to stop beyond the talus and within a particular 10 by 10 m sector of the shadow, Evans and Hungr (1993) determined a return period on the order of 1000 years for rock falls in British Columbia. Each of the four study areas in Yosemite Valley is large enough to be subject to potential rock falls from several sources, so the return period for a similar site within the shadow is probably less than 1000 years.
However unlikely, large rock avalanches starting from high on the valleywalls are capable of traveling far into the valley. The abundant scars of previous large rock falls on the valley walls attest to the potential for such events in the future from many locations, including the four study areas. With a very small number of large rock avalanche deposits (5) which occurred within Yosemite Valley in the last 15,000 years, an average return period cannot be reliably determined, but is probably longer than that for boulders to reach and stop within the rock-fall shadow. Because of the configuration of the high steep valley walls and the relatively narrow valley, it should be noted that there are no absolutely safe or zero probability areas.
Conclusions
There is ample prehistoric and historic evidence of potential rock-fall hazard within the Yosemite Valley. The risk posed by rock falls of even small size includes casualties and destruction of structures. Acceptable levels of risk for engineering projects typically depend upon the annual probability of failure versus the consequence of failure, that is monetary loss or lives lost (Fell, 1993). The results of this study have shown in map form where the highest rock-fall hazard exists and have given some general indication of the expected frequency of these events; however, the study has not quantified the probability at any specific location, nor evaluated the risk, that is the exposure of people or facilities to such events.
Acknowledgements
This work was partly funded by the National Park Service. This work was partially supported through a CNR International Scholarship (203.05.18-1996) to Giulio Iovine, one of the authors.
References
Evans, S.G., and Hungr, O., 1993, The assessment of rockfall hazard at the base of talus slopes, Canadian Geotechnical Journal, v. 30, pp. 620-636.
Fell, Robin, 1994, Landslide risk assessment and acceptable risk, Canadian Geotechnical Journal, v. 31, pp. 261-272.
Hungr, O., 1995, A model for the runout analysis of rapid flow slides, debris flows, and avalanches: Canadian Geotechnical Journal, v. 32, pp. 610-623.
Hungr, O. and Evans, S.G., 1988, Engineering evaluation of fragmental rockfall hazards. In Landslides, Proceedings of the 5th International Symposium on Landslides, Lausanne. Ed. C. Bonnard. A.A. Balkema, Rotterdam. V. 1, pp. 685-690.
Jäger, Stefan, 1997, Fallstudien zur Bewertung von Massenbewegungen als geomorphologische Naturgefahr, Heidelberger Geographische Arbeiten, Heft 108, 151p. (In German).
Li, Tianchi, 1983, A mathematical model for predicting the extent of a major rockfall, Zeitschrift fur Geomorphologie, v. 27, n. 4, pp. 473-482.
Matthes, F.E., 1930, Geologic history of the Yosemite Valley: U.S. Geological Survey Professional Paper 160, 137 p.
Pfeiffer, T.J., Higgins, J.D., Andrew, R.D., Barrett, R.K., and Beck, R.B., 1993, Colorado Rockfall Simulation Program--users manual for version 3.0: Colorado Department of Transportation Report No. CDOT-DTD-ED3-CS-2B, 66 p.
Rapp, A., 1960, Recent developments of mountain slopes in Kårkevagge and surroundings, northern Scandinavia: Geografiska Annaler, v. 42, pp. 65-200.
Snyder, J., 1996, The ground shook and the sky fell: Yosemite Association, Fall 1996, v. 58, n. 4, p. 2- 9.
Wieczorek, G.F., and Jäger, Stefan, 1996, Triggering mechanisms and depositional rates of postglacial slope-movement processes in the Yosemite Valley, California: Geomorphology, v. 15, p. 17- 31.
Wieczorek, G.F., Snyder, J.B., Alger, C.S., and Isaacson, K.A., 1992, Rock falls in Yosemite Valley, California: U.S. Geological Survey Open-File Report 92-387, 38 p., 2 appendixes, 4 plates.
|
|
(L*W*T) |
angle (1) |
angle (2) |
||
|
|
|
|
|
||
|
|
|
||||
|
|
|
||||
|
|
|
||||
|
|
|
||||
|
|
|
||||
|
|
|
||||
|
|
|
|
|||
|
|
|
||||
|
|
|
|
|
||
|
|
|
||||
|
|
|
||||
|
|
|
|
|
||
|
|
|
||||
|
|
|
||||
|
|
|
||||
|
|
|
|
|
||
|
|
|
||||
|
|
|
||||
|
|
|
||||
|
|
|
||||
|
|
|
||||
|
|
|
||||
|
|
|
||||
|
|
|
||||
|
|
|
|
Table 1 - Measurements of size and shadow angle
for outlying boulders. Identification number (Id.) of locations shown on
Plate 1. Note that we have not included boulders shown on Plate 1 which
we did not measure. L=length; W=width; T=thickness; 1=computed values;
2=observed values.
|
Id. |
|
(V) |
Fall (H) |
(L) |
|
|
|
|
|
|
|
|
|
|
|
|
|
|
|
|
|
Bridge |
|
|
|
|
|
|
|
|
|
|
|
|
|
|
|
|
|
|
|
|
Lake |
|
|
|
|
Table 2 - Characteristics of large rock avalanches
in Yosemite Valley which are shown by letter (a-e) on the map. The range
of height of fall and length of runout reflects different methods of estimation.
For the Mirror Lake rock avalanche, aerial-photo evidence suggests that
the deposit consists of two separate events so the volume as listed is
too large representing both events. Likewise, the length of runout for
the Mirror Lake rock avalanche may be somewhat small because the runout
was confined by the opposite valley wall.
FIGURES
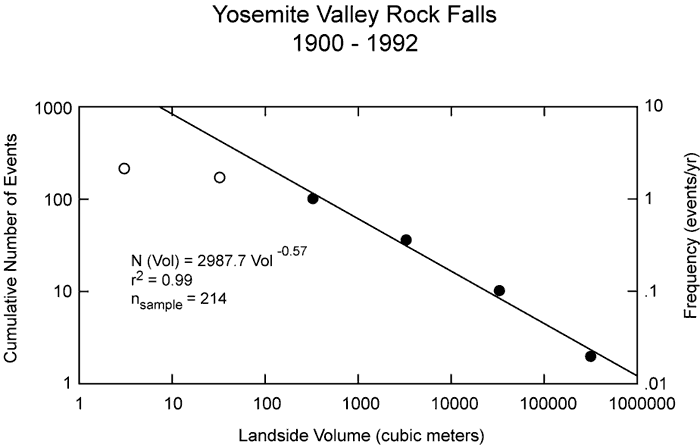
Figure 1. Graph of volume-frequency distribution of rock falls in the Yosemite Valley from 1900-1992 (from Wieczorek et al., 1995).
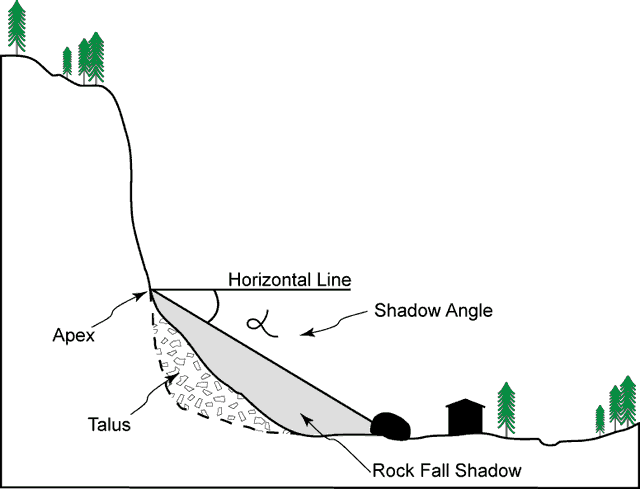
Figure 2. Sketch of rock-fall talus at base of slope and outlying boulders illustrating rock-fall shadow and shadow angle (after Evans and Hungr, 1993)
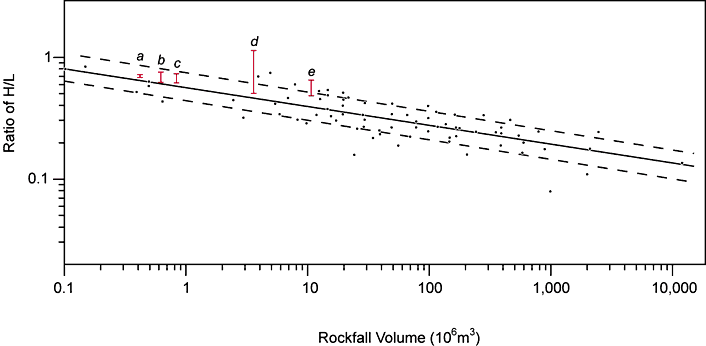
Figure 3. Graph of volume versus ratio of H (height) to L (length) of worldwide rock falls (modified from Li, 1983). Letters (a to e) represent large rock avalanches in Yosemite Valley shown on Plate 1 and listed in Table 2. Bar indicates range of uncertainty for measurement of ratio of H/L.
| AccessibilityFOIAPrivacyPolicies and Notices | |
| |
|