Open-File Report 99-141
Geologic Map of the Scotts Mills,
Silverton, and
Stayton Northeast 7.5 Minute
Quadrangles,
Northwest Oregon: A Digital
Database
Geology by Terry Tolan and Marvin Beeson,
Digital Database by Karen L. Wheeler
(click on images for better view of maps) NOTE: This
image is not an authoritative representation of the data.
| This report is preliminary and has not been reviewed
for conformity with U.S. Geological Survey editorial standards or with
the North American Stratigraphic Code. Any use of trade, product, or firm
names is for descriptive purposes only and does not imply endorsement by
the U.S. Government.
This database, identified as "Geologic Map of the Scotts Mills, Silverton, and Stayton Northeast 7.5 Minute Quadrangles: A Digital Database" has been approved for release and publication by the Director of the USGS. Although this database has been subjected to rigorous review and is substantially complete, the USGS reserves the right to revise the data pursuant to further analysis and review. Furthermore, it is released on condition that neither the USGS nor the United States Government may be held liable for any damages resulting from its authorized or unauthorized use. |
1Department of Geology, Portland State University, Portland, Oregon 97207-0751
2U.S. Geological Survey, 345 Middlefield Rd. MS-975, Menlo Park, CA 94025
Introduction
For those who don't use digital geologic map databases
Digital Open-File contents
PostScript plot file package
PDF plot file package
Digital database package
Tar files
PostScript plot files
PDF plot files
Digital database format
Obtaining the Digital Database and Plot file Packages
To obtain tar files of database or plot file packages from the USGS web pages
To obtain tar files of database or plot file packages by ftp
To obtain tar files of database or plot file packages on tape
Obtaining plots from a commercial vendor
Obtaining plots from a U.S.G.S. Open File Services
Converting ARC export files
Digital compilation
Base maps
Spatial resolution
Database specifics
Lines
Areas
Points
Annotation
Acknowledgments
References Cited
Introduction
This Open-File report is a digital geologic map database. This pamphlet serves to introduce and describe the digital data. There is no paper map included in the Open-File report. The report does include, however, PostScript plot files containing images of two geologic map sheets with explanation, as well as the accompanying text describing the geology of the area. For those only interested in a paper plot of information contained in the database or in obtaining the PostScript plot files, please see the section entitled "For Those Who Don't Use Digital Geologic Map Databases" below.
This digital map database, compiled from previously published and unpublished data, and new mapping by the authors, represents the general distribution of bedrock and surficial deposits of the Scotts Mills, Silverton, and Stayton NE 7.5 minute quadrangles along the eastern margin of the Willamette Valley and adjacent lower foothills (Waldo and Silverton Hills) of the Cascade Range. The major emphasis of this investigation was to identify and map Columbia River Basalt Group (CRBG) units within the Scotts Mills, Silverton, and Stayton NE quadrangles and to utilize this detailed CRBG stratigraphy to identify and characterize structural features. Together with the accompanying text file (geol.txt or geol.ps), it provides current information on the geologic structure and stratigraphy of the area covered. The database delineates map units that are identified by general age and lithology following the stratigraphic nomenclature of the U.S. Geological Survey. The scale of the source maps limits the spatial resolution (scale) of the database to 1:24.000 or smaller. The content and character of the database, as well as three methods of obtaining the database, are described below.
For those who don't use digital geologic map databases
For those interested in the geology of the Northwest Oregon region of the Scotts Mills, Silverton, and Stayton NE 7.5 minute quadrangles who do not use an ARC/INFO compatible Geographic Information System (GIS), we have provided two sets of plot files containing images of much of the information in the database. There is a set of images in PostScript format and another in Adobe Acrobat PDF format (see the sections "PostScript plot files" and "PDF plot files" below).
Those interested who have computer capability can access the plot file packages in any of the three ways described below (see the section "Obtaining the Digital Database and Plotfile packages"). However, it should be noted the plot file packages do require gzip and tar utilities to access the plot files. Therefore additional software, available free on the Internet, may be required to use the plot files (see section "Tar files").
Those without computer capability can obtain plots of the map files through USGS plot-on-demand service for digital geologic maps (see section "Obtaining plots from USGS Open-File Services") or from an outside vendor (see section "Obtaining plots from an outside vendor").
Digital Open-File contents
This Open-File report consists of three
digital packages. The first is the "PostScript Plot file Package",
which consists of PostScript plot files of three geologic maps with explanations
(Sheets 1-2), as well as a PostScript version of a geologic description
pamphlet, figures 1-5, and table 1. The second is the "PDF Plot file
Package", and contains the same plot files as the first package, but
in Portable Document Format (PDF). The third is the "Digital Database
Package", and contains the geologic map database itself, and the supporting
data, including base maps, map explanation, geologic description, and references.
PostScript plot file package
This package contains the images described here in PostScript format (see below for more information on PostScript plot files):
svsc99222ru.ps A PostScript plottable file containing an image of the geologic map and base maps of the Silverton and Scotts Mills 7.5 minute quadrangles at a scale of 1:24,000 (Sheet 1).
stn99222u.ps A PostScript plottable file containing an image of the geologic map and base maps of the Stayton NE 7.5 minute quadrangle at a scale of 1:24,000 (Sheet 2).
geol.ps A PostScript plot file of a report containing detailed unit descriptions and geological information, plus sources of data and references cited.
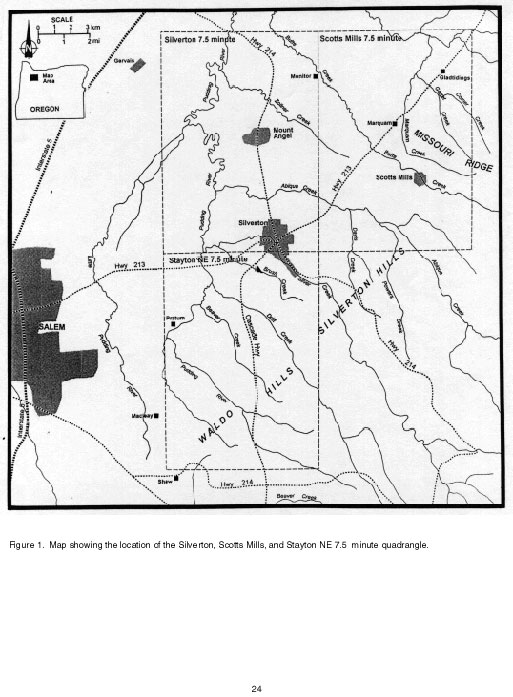
fig1.eps An Encapsulated PostScript file of Figure 1 which is referred to by geol.ps. Map showing the location of the Silverton, Scotts Mills, and Stayton NE 7.5 minute quadrangle.
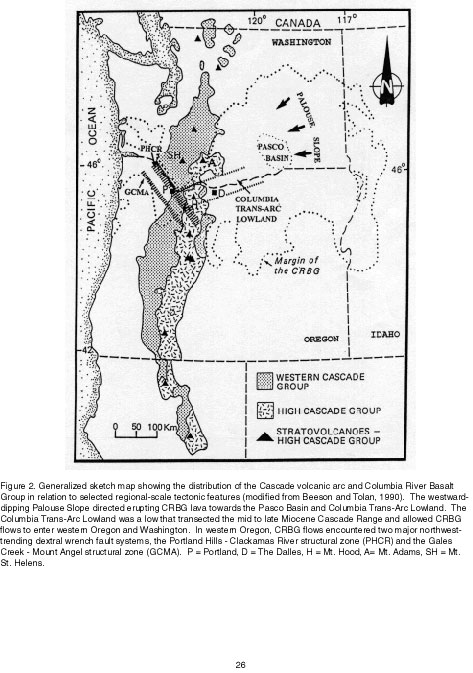
fig2.eps An Encapsulated PostScript file of Figure 2 which is referred to by geol.ps. Generalized sketch map showing the distribution of the Cascade volcanic arc and Columbia River Basalt Group in relation to selected regional-scale tectonic features (modified from Beeson and Tolan, 1990). The westward-dipping Palouse Slope directed erupting CRBG lava towards the Pasco Basin and Columbia Trans-Arc Lowland. The Columbia Trans-Arc Lowland was a low that transected the mid to late Miocene Cascade Range and allowed CRBG flows to enter western Oregon and Washington. In western Oregon, CRBG flows encountered two major northwest-trending dextral wrench fault systems, the Portland Hills - Clackamas River structural zone (PHCR) and the Gales Creek - Mount Angel structural zone (GCMA). P = Portland, D = The Dalles, H = Mt. Hood, A= Mt. Adams, SH = Mt. St. Helens.
fig3.eps An Encapsulated PostScript file of Figure 3 which is referred to by geol.ps. Sketch map showing the locations of major CRBG intracanyon flow pathways western Oregon and Washington. Modified from Beeson and Tolan (1996).
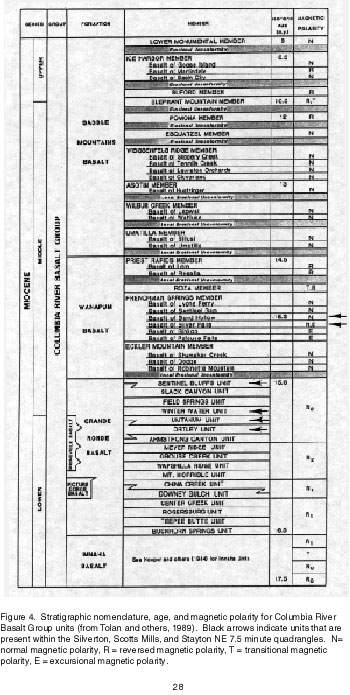
fig4.eps An Encapsulated PostScript file of Figure 4 which is referred to by geol.ps. Stratigraphic nomenclature, age, and magnetic polarity for Columbia River Basalt Group units (from Tolan and others, 1989). Black arrows indicate units that are present within the Silverton, Scotts Mills, and Stayton NE 7.5 minute quadrangles. N= normal magnetic polarity, R = reversed magnetic polarity, T = transitional magnetic polarity, E = excursional magnetic polarity.
fig5.eps An Encapsulated PostScript file of Figure 5 which is referred to by geol.ps. Maps showing the regional extent of Columbia River Basalt Group unit, Scotts Mills, and Stayton NE 7.5 minute quadrangles. A = basalt of Sand Hollow, Frenchman Springs Member, Wanapum Basalt; B = basalt Silver Falls, Frenchman Springs Member, Wanapum Basalt; C = Sentinel Bluffs Member, Grande Ronde Basalt; D= Winter Water Member, Grande Ronde Basalt; E = Ortley Member, Grande Ronde Basalt; F= Umtanum Member, Grande Ronde Basalt. Note that Ortley and Umtanum Members are shown as an undifferentiated unit (Tgou) on the geologic map and cross-section. Distribution maps from Tolan and others (1989) and Reidel and others (1989).
table1.eps An Encapsulated PostScript
file of Table 1 which is referred to by geol.ps. Chemical composition
of Little Butte Volcanics and Columbia River Basalt Group units - Scotts
Mills, Silverton, and Stayton NE 7.5 minute quadrangles.
PDF plot file package
This package contains the images described here in PDF format (see below for more information on PDF plot files):
svsc.pdf A PDF containing an image of the geologic map and base maps of the Silverton and Scotts Mills 7.5 minute quadrangles at a scale of 1:24,000 (Sheet 1).
stn.pdf A PDF containing an image of the geologic map and base maps of the Stayton NE 7.5 minute quadrangle at a scale of 1:24,000 (Sheet 2).
geol.pdf A PDF of a report containing detailed unit descriptions and geological information, plus figures, table, sources of data, and references cited.
readme.pdf
A PDF of this document.
Digital database package
The database package includes geologic
map database files for the the Silverton, Scotts Mills, and Stayton NE
7.5 minute quadrangles. The digital maps, or coverages, along with their
associated INFO directory have been converted to uncompressed ARC/INFO
export files. ARC export files promote ease of data handling, and are usable
by some Geographic Information Systems in addition to ARC/INFO (see below
for a discussion of working with export files). Raster data are stored
in ARC grid format rather than export format to reduce file size. The ARC
export files and associated ARC/INFO coverages, grids, and directories,
as well as the additional digital material included in the database, are
described below:
| ARC/INFO export file | Resultant Coverage | Description of Coverage |
| Silverton quadrangle | ||
| slv_geo.e00 | slv_geo/ | Faults, depositional contacts, and rock units in the quadrangle |
| slv_stx .e00 | slv_stx/ | Geologic attitudes as points include pttype, strike, dip fields, dip values as annotation, fold axis as arcs, cross-section arc |
| slv_well.e00 | slv_well/ | Wells as points |
| slv_neat.e00 | slv_neat/ | Neatline for Silverton and Scotts Mills |
| Scotts Mills quadrangle | ||
| scm_geo.e00 | scm_geo/ | Geology polys, contacts,
faults, polygon labels ptype = geology formation |
| scm_stx.e00 | scm_stx/ | Geologic attitudes as points include pttype, strike, dip fields, dip values as annotation, fold axis as arcs, cross-sections as arcs |
| ARC/INFO Grid | Description of Grid | |
| svscgbc | Silverton and Scotts Mills color geology grids merged with respective grids of topographic bases | |
| ARC/INFO export file | Resultant Coverage | Description of Coverage |
| Stayton NE quadrangle | ||
| stn_geo.e00 | stn_geo/ | Geology polys, contacts, faults, polygon labels ptype = geology formation |
| stn_stx.e00 | stn_stx/ | Geologic attitudes as points include pttype, strike, dip fields, dip values as annotation, fold axis as arcs, cross-section as arc |
| stn_neat.e00 | stn_neat/ | Neatline along outermost edge of map |
| ARC/INFO Grid | Description of Grid | |
| stngb | Stayton NE color geology
grid merged with grid of topographic base |
The database package also includes the
following files: ASCII text files, including explanatory text, Encapsulated
PostScript files from Adobe Illustrator 5.5 used as map collars and Figures
1-5, and table 1 (JPEG) for the geologic report, ARC Macro Language files
for plotting maps, custom ARC symbolsets, ARC/INFO look-up tables and a
ARC Macro Language file for conversion of ARC export files into ARC coverages:
| geol.txt | A text-only file containing an unformatted version of geol.ps. |
| readme.txt | This file as text with end of line marks. |
| import.aml | ASCII text file in ARC Macro Language to convert ARC export files to ARC coverages in ARC/INFO |
| sh1o.eps | Encapsulated PostScript Adobe Illustrator 5.5 file (map collar) for Silverton and Scotts Mills quadrangles |
| sh2o.eps | Encapsulated PostScript Adobe Illustrator 5.5 file (map collar) for Stayton NE quadrangle |
| svscplot.aml | Plot AML generates uncompressed PostScript of Silverton and Scotts Mills quadrangles (Sheet 1) |
| stnplot.aml | Plot AML generates uncompressed PostScript of Stayton NE quadrangle (Sheet 2) |
| geol61.lin | Custom ARC lineset |
| johanna.txt | Custom ARC textset |
| landu | Parameter file in svscplot.aml to uncompress and rotate PostScript file 90 degrees |
| uncom | Parameter file in stnplot.aml to uncompress PostScript file |
| fnt038 | ARC/INFO font used with markerset |
| fnt039 | ARC/INFO font used with markerset |
| stnpoly_utm10.prj | ARC/INFO projection file for Stayton NE dataset |
| slvpoly_utm10.prj | ARC/INFO projection file for Silverton dataset |
| scmpoly_utm10.prj | ARC/INFO projection file for Scotts Mills dataset |
| scm.tab | ARC/INFO grid remap table for colors (Scotts Mills and Silverton) |
| stn.tab | ARC/INFO grid remap table for colors (Stayton NE) |
| info | ARC/INFO directory |
| log | ARC/INFO log file |
| alc1.shd | ARC/INFO shadeset (custom) |
| geologyk.mrk | ARC/INFO markerset (custom) |
| oilgas.mrk | ARC/INFO markerset |
| geol61c.lut | ARC/INFO line look up table (internal) exported as geol61c.lut.e00 |
| droid.lut | ARC/INFO marker look up table (internal) exported as droid.lut.e00 |
| fline.lut | ARC/INFO line look up table for folds (internal) exported as fline.lut.e00 |
| fmark.lut | ARC/INFO look up table for fold and fault markers (internal) exported as fmark.lut.e00 |
| stn_geo3l.lut | ARC/INFO look up table (internal) exported as stn_geo3l.lut.e00 |
| fig1.jpg | Figure 1 referred to by geology report. |
| fig2.jpg | Figure 2 referred to by geology report. |
| fig3.jpg | Figure 3 referred to by geology report. |
| fig4.jpg | Figure 4 referred to by geology report. |
| fig5.jpg | Figure 5 referred to by geology report. |
| table1.jpg | Table 1 referred to by geology report. |
| stn_geo.lut | ARC/INFO look up table (internal) exported as stn_geo.lut.e00 |
The following supporting directory is not
included in the database package, but is produced in the process of reconverting
the export files into ARC coverages:
| info/ INFO directory containing files supporting the databases. |
Tar files
The two data packages described above are
stored in tar (UNIX tape archive) files. A tar utility is required to extract
the database from the tar file. This utility is included in most UNIX systems,
and can be obtained free of charge over the Internet from Internet Literacy's
Common Internet File Formats Webpage (http://www.matisse.net/files/formats.html).
Both tar files have been compressed, and may be uncompressed with gzip,
which is available free of charge over the Internet.
When the tar file is uncompressed and the data is extracted from the tar
file, a directory is produced that contains the data in the package as
described above. The specifics of the tar files are listed below:
| Name of compressed tar file | Size of compressed tar file (uncompressed) | Directory produced when extracted from tar file | Data package contained |
| sssofrps.tar.gz | 80.8 MB (372 MB) | sssofrps/ | PostScript Plot file Package |
| sssofrpdf.tar.gz | 11.2 MB (22.3 MB) | sssofrpdf/ | Portable Document Format Package |
| sssofr.tar.gz | 10 MB (28.8 MB) | sssofr/ | Digital Database Package |
PostScript plot files
For those interested in the geology of the Northwest Oregon region of the Scotts Mills, Silverton, and Stayton NE 7.5 minute quadrangles who don't use an ARC/INFO compatible GIS system we have included a separate data package with three PostScript plot files. The first two each contain a color plot of the geologic map database at 1:24,000 scale (Sheet 1 and 2, svsc99222ru.ps, stn99222u.ps). Because this release is primarily a digital database, the plot files (and plots derived therefrom) have not been edited to conform to U.S. Geological Survey standards. Small units have not been labeled with leaders and in some instances map features or annotation overlap. Sample plots by the authors have proven to be quite legible and useful, however. In addition, another PostScript file containing the geologic description and discussion is provided (geol.ps). It refers to five figures and a table which were individually converted to PostScript (fig1.eps, fig2.eps, fig3.eps, fig4.eps, fig5.eps, table1.eps).
The PostScript image of the geologic maps are 42 by 34 inches (Sheet 1), and 35 by 32 inches (Sheet 2), so they require a large plotter to produce paper copies at the intended scale. The geologic description and figures are on 8.5 by 11 inch pages.
The PostScript plot files for maps were produced by the PostScript command using the uncompressed option in ARC/INFO version 7.2.1 for NT. The PostScript plot files for pamphlets were produced in Microsoft Word using the Destination PostScript File option from the Print command. The five figures for the pamphlet were produced in Adobe Illustrator and saved as version 5.5 Encapsulated PostScript files, as well as the two map templates (sh1o.eps, sh2o.eps), which each contain a color plot of the map key, index map, cross-sections, and other graphics in map collar, (they were used as Placed EPS in the PostScript files from ARC/INFO).
Each final ARC/INFO PostScript file contains an Encapsulated PostScript file generated by Adobe Illustrator version 5.5 and placed into the ARC/INFO graphic metafile by an ARC plotting AML. These EPS files include the marginal graphics and explanation of each of the maps. In the ARC/INFO PostScript file named svsc99222ru.ps, the EPS is called sh1o.eps. In the PostScript file named stn99222u.ps, the EPS is called sh2o.eps.
The svscplot.aml and stnplot.aml take the various coverages and grids and produce printable PostScript files of the Scotts Mills, Silverton, and Stayton NE files. The import.aml imports all the export (.e00) files into ARC/INFO.
PDF plot files
We have also included a second digital package containing PDF versions of the PostScript map sheets and pamphlet described above. Adobe Acrobat PDF (Portable Document Format) files are similar to PostScript plot files in that they contain all the information needed to produce a paper copy of a map or pamphlet and they are platform independent. Their principal advantage is that they require less memory to store and are therefore quicker to download from the Internet. In addition, PDF files allow for printing of portions of a map image on a printer smaller than that required to print the entire map without the purchase of expensive additional software. All PDF files in this report have been created from PostScript plot files using Adobe Acrobat Distiller. In test plots we have found that paper maps created with PDF files contain almost all the detail of maps created with PostScript plot files. We would, however, recommend that those users with the capability to print the large PostScript plot files use them in preference to the PDF files.
To use PDF files, the user must get and install a copy of Adobe Acrobat Reader. This software is available free from the Adobe website (http://www.adobe.com). Please follow the instructions given at the website to download and install this software. Once installed, the Acrobat Reader software contains an on-line manual and tutorial.
There are two ways to use Acrobat Reader
in conjunction with the Internet. One is to use the PDF reader plug-in
with your Internet browser. This allows for interactive viewing of PDF
file images within your browser. This is a very handy way to quickly look
at PDF files without downloading them to your hard disk. The second way
is to download the PDF file to your local hard disk, and then view the
file with Acrobat Reader.
| We strongly recommend that large map images be handled by downloading to your hard disk, because viewing them within an Internet browser tends to be very slow. |
To print a smaller portion of a PDF map image using Acrobat Reader, it is necessary to cut out the portion desired using Acrobat Reader and the standard cut and paste tools for your platform, and then to paste the portion of the image into a file generated by another software program that can handle images. Most word processors (such as Microsoft Word) will suffice. The new file can then be printed. Image conversion in the cut and paste process, as well as changes in the scale of the map image, may result in loss of image quality. However, test plots have proven adequate.
Digital database format
The databases in this report were compiled in ARC/INFO, a commercial Geographic Information System (Environmental Systems Research Institute, Redlands, California) ), with version 3.0 of the menu interface ALACARTE (Fitzgibbon and Wentworth, 1991, Fitzgibbon, 1991, Wentworth and Fitzgibbon, 1991). The files are in either GRID (ARC/INFO raster data) format or COVERAGE (ARC/INFO vector data) format. Coverages are stored in uncompressed ARC export format (ARC/INFO version 7.2.1 for NT). ARC/INFO export files (files with the .e00 extension) can be converted into ARC/INFO coverages in ARC/INFO (see below) and can be read by some other Geographic Information Systems, such as MapInfo via ArcLink and ESRI's ArcView (version 1.0 for Windows 3.1 to 3.11 is available for free from ESRI's web site: http://www.esri.com). The digital compilation was done in version 7.2.1 of ARC/INFO for NT.
Obtaining the Digital Database and Plot file Packages
The digital data can be obtained in any of three ways:
a. From the Western Region Geologic Information Web Page
b. Anonymous ftp over the Internet
c. Sending a tape with request
Converting ARC export files
ARC export files are converted to ARC coverages using the ARC command IMPORT with the option COVER. To ease conversion and maintain naming conventions, we have included an ASCII text file in ARC Macro Language that will convert all of the export files in the database into coverages and create the associated INFO directory. From the ARC command line type:
Arc: &run import.aml
ARC export files can also be read by some other Geographic Information Systems. Please consult your GIS documentation to see if you can use ARC export files and the procedure to import them.
Digital compilation
Several different coverages were generated during the construction of each of the three geologic quadrangle maps. Negatives of USGS topographic bases and geologic mylar tracings were scanned at 400 dpi, 1-bit TIFF bi-level compression type 1 (uncompressed) with rows per strip = 12000 on an ANATEK rasterizing scanner, then images were converted to ESRI ARC/INFO grids. The raster grids were converted to vector coverages with ARC/INFO's gridline routine. Alacarte and some custom menus and amls were used to project, transform, edit, tag and build, lines, polygons, and points in each map. A digital layout or map collar was made with Adobe Illustrator. The plot amls run in ARC/INFO and call the coverages, grids, and EPS to make uncompressed PostScript files. All maps are in UTM projection, zone 10, units meters, 1:24,000 scale. The pamphlet that describes the geology is saved to EPS from Microsoft Word.
Base maps
The source of the base maps used is the U.S. Geological Survey, 1:24,000 scale topographic maps, which have a 10-foot contour intervals (provisional edition, 1987). One base map layer for each of the three 7.5 minute quadrangles was prepared from negatives. Topographic bases for Scotts Mills, Silverton, and Stayton NE quadrangles were scanned on an Ideal rasterizing scanner at 400 dpi as 1-bit TIFF images. Scanned TIFF images of the bases were registered and rectified in ARC/INFO and then made into grids. The images were clipped using ARC/INFO grid to conform to the area of the geologic coverages and merged with the geology grid to give an apparent transparent color image of both combined. These base map-geology layers are digital images but no information other than location is attached to the lines. The base-geology maps are provided for reference only.
Spatial resolution
Uses of this digital geologic map should not violate the spatial resolution of the data. Although the digital form of the data removes the constraint imposed by the scale of a paper map, the detail and accuracy inherent in map scale are also present in the digital data. The fact that this database was edited at a scale of 1:24,000 means that higher resolution information is not present in the dataset. Plotting at scales larger than 1:24,000 will not yield greater real detail, although it may reveal fine-scale irregularities below the intended resolution of the database. Similarly, where this database is used in combination with other data of higher resolution, the resolution of the combined output will be limited by the lower resolution of these data.
Database specifics
The map databases consist of ARC coverages and supporting INFO files, which are stored in a UTM (Universal Transverse Mercator) projection (Table 1). Digital tics define a 7.5 minute grid of latitude and longitude in the coverages corresponding with quadrangle corners.
Table 1 - Map Projection
| PROJECTION UTM UNITS METERS -on the ground ZONE 10 -UTM zone PARAMETERS END |
Table 2 - Field Definition Terms
| ITEM NAME | name of the database field (item) |
| WIDTH | maximum number of digits or characters stored |
| OUTPUT | output width |
| TYPE | B-binary integer, F-binary floating point number, I-ASCII integer, C-ASCII character string |
| N. DEC. | number of decimal places maintained for floating point numbers |
The lines (arcs) are recorded as strings of vectors and are described in the arc attribute table (Table 3). They define the boundaries of the map units, faults, and the map boundaries. These distinctions, including the geologic identities of the unit boundaries, are recorded in the LTYPE field according to the line types listed in Table 4.
Table 3 - Content of the Arc Attribute
Tables
| ITEM NAME | DESCRIPTION | ||||
| FNODE# | starting node of arc (from node) | ||||
| TNODE# | ending node of arc (to node) | ||||
| LPOLY# | polygon to the left of the arc | ||||
| RPOLY# | polygon to the right of the arc | ||||
| LENGTH | length of arc in meters | ||||
| <coverage# | unique internal control number | ||||
| <coverage-ID | unique identification number | ||||
| LTYPE | line type (see Table 4) | ||||
| SEL | user-defined field used to save a selected set | ||||
| SYMB | user defined field used to save symbol assignments (such as color) |
Table 4 - Line Types Recorded in
the LTYPE Field (listed by coverage name)
| GEOLOGY | STRUCTURE | NEATLINE |
| scm_geo contact, inferred contact, inferred, queried map boundary normal fault, concealed normal fault, inferred normal fault, inferredm |
scm_stx cross-section f.a., anticline, certainm f.a., anticline, concealed f.a., anticline, concealed, queried f.a., anticline, inferred f.a., anticline, inferred, queried f.a., anticline, inferredm |
|
| slv_geo contact, inferred fault, concealed map boundary normal fault, concealed normal fault, concealedm normal fault, inferred normal fault, inferredm |
slv_stx cross-section f.a., monocline, concealed f.a., monocline, concealedm f.a., monocline, inferred f.a., monocline, inferredm f.a., monocline, plunge |
slv_neat map boundary |
| stn_geo contact, inferred contact, inferred, queried fault, concealed fault, inferred map boundary normal fault, concealed normal fault, concealedm normal fault, inferred normal fault, inferredm |
stn_stx cross-section f.a., anticline, certain f.a., anticline, certainm f.a., anticline, plunge |
stn_neat map boundary |
Areas
Map units (polygons) are described in the polygon attribute table (Table 5) The identities of the map units from compilation sources are recorded in the PTYPE field by map label (Table 6). Note that ARC/INFO coverages cannot contain both point and polygon information, so only coverages with polygon information will have a polygon attribute table, and these coverages will not have a point attribute table. More complete descriptions of the various rock units can be found in the geologic report that accompanies this dataset, geol.txt or geol.ps.
Table 5 - Content of the Polygon
Attribute Tables
| ITEM NAME | DESCRIPTION | ||||
| AREA | area of polygon in square meters | ||||
| PERIMETER | length of perimeter in meters | ||||
| <coverage# | unique internal control number | ||||
| <coverage-ID | unique identification number | ||||
| PTYPE | unit label | ||||
| SEL | user defined field used to save a selected set | ||||
| SYMB | user defined field used to save symbol assignments (such as color) |
Table 6 - Map Units
(See geol.txt
or geol.ps for descriptions of units)
| Qal | Alluvial deposits (Holocene) |
| Qoal | Older alluvial deposits (Pleistocene) |
| Qls | Landslide deposits (Pleistocene to Holocene) |
| Tsa | Sardine Formation (late Miocene to Pliocene?) |
| COLUMBIA RIVER BASALT GROUP | |
| Frenchman Springs Member, Wanapum Basalt | |
| Tfsh | Basalt of Sand Hollow (middle Miocene) |
| Tfsf | Basalt of Silver Falls (middle Miocene) |
| Grande Ronde Basalt | |
| Tgsb | Sentinel Bluffs member (middle Miocene) |
| Tgww | Winter Water member (middle Miocene) |
| Tgou | Ortley and Umtanum members (middle Miocene) |
| Tsm | Scotts Mills Formation-undifferentiated (Oligocene to lower Miocene?) |
| Tlb | Little Butte Volcanics (late Eocene(?) to Oligocene(?)) |
Note: QTs occurs only in subsurface, and is not on maps and is undifferentiated fluvial sediments (Quaternary to late Miocene); Tfu Undifferentiated Frenchman Springs Member-occurs only in subsurface and is not on maps; Tgu Normal Magnetic Polarity (N2) flows, undifferentiated (middle Miocene)-occurs only in subsurface.
Points
Data gathered at a single locality (points)
are described in the point attribute table (Table 7). The identities
of the points from compilation sources are recorded in the PTTYPE field
by map label (Table 8). Map units are described more fully in the
accompanying text file geol.txt or geol.ps. Note that ARC/INFO coverages
cannot contain both point and polygon information, so only coverages with
point information will have a point attribute table, and these coverages
will not have a polygon attribute table.
Table 7 - Content of the Point Attribute Tables
Geologic Attitudes
| ITEM NAME | DESCRIPTION | ||||
| AREA | area of polygon in square meters | ||||
| PERIMETER | length of perimeter in meters | ||||
| <coverage# | unique internal control number | ||||
| <coverage-ID | unique identification number | ||||
| PTTYPE | attitude label | ||||
| DIP | dip of bedding or foliation | ||||
| STRIKE | strike of bedding or foliation | ||||
| SEL | user defined field used to save a selected set | ||||
| SYMB | user defined field used to save symbol assignments (such as color) |
Well data points
(Silverton quadrangle only)
| ITEM NAME | WIDTH | OUTPUT | TYPE | N. DEC. | DESCRIPTION |
| AREA | 4 | 12 | F | 3 | area of polygon in square meters |
| PERIMETER | 4 | 12 | F | 3 | length of perimeter in meters |
| SLV_WELL# | 4 | 5 | B | unique internal control number | |
| SLV_WELL-ID | 4 | 5 | B | unique identification number | |
| PTTYPE | 35 | 35 | C | point label | |
| SEL | 1 | 1 | I | user defined field used to save a selected set | |
| SYMB | 3 | 3 | I | user defined field used to save symbol assignments (such as color) | |
| SAMPNO | 35 | 35 | C | sample number to identify well | |
| TOB | 10 | 10 | C | elevation relative to sea level to top of basalt in feet |
Table 8 -Point Types Recorded in
the PTTYPE Field (listed by coverage name)
| STRUCTURE | WELLS |
| scm_stx bedding vert joint |
|
| slv_stx bedding |
slv_well well location |
| stn_stx bedding vert joint |
Annotation
Within each structural coverage is an annotation showing dip amount associated with each attitude. This annotation layer is called by the plot amls used by ARC/INFO, using a custom ARC textset, johanna.txt. The plot amls convert all coverages into a two PostScript files. Map unit labels (not annotation) are used to label geology polygons. Smaller polygons, in which the label would not fit, can be identified on plots by the color of the polygon.
Acknowledgments
We wish to thank the digital reviewer, Dave Ramsey, for the digital review of this Open File Report 99-141.
References Cited
Fitzgibbon, T.T., 1991, ALACARTE installation and system manual (version 1.0): U.S. Geological Survey Open-File Report 91-587B.Fitzgibbon, T.T., and Wentworth, C.M., 1991, ALACARTE user interface - AML code and demonstration maps (version 1.0): U.S. Geological Survey Open-File Report 91-587A.
Wentworth, C.M., and Fitzgibbon, T.T., 1991, ALACARTE user manual (version 1.0): U.S. Geological Survey Open-File Report 91-587C.

![]() U.S. Department of the Interior |
U.S. Geological Survey
U.S. Department of the Interior |
U.S. Geological Survey
URL: http://pubsdata.usgs.gov/pubs/of/1999/0141/readme.html
Page Contact Information: GS Pubs Web Contact
Page Last Modified: Wednesday, 07-Dec-2016 17:50:24 EST
