 Overview
This open-file report was prepared in support of the USGS Earthquake Hazards of Cascadia Project. The primary objective of this phase of the project is to determine recurrence intervals of turbidites in Cascadia basin-floor channel systems and evaluate implications of this event record for the paleoseismic history of the Cascadia subduction zone. The purpose of this study is to determine whether the canyon/channel systems themselves are blocked or deformed in such a way that the downstream turbidite stratigraphy might be biased. To accomplish this investigation approximately 7500 kilometers of pre-existing 3.5 KHz seismic data were evaluated to determine the direction and extent of the Astoria Channel/pathway system, which originates at the base of the Astoria Fan. Additionally, distribution and thickness of turbidite sediment sequences were determined along each identified pathway. Bathymetery and distance were used to determine gradients along the main pathway axis and for each of the secondary pathways that feed into it.
Channel pathways were identified on the basis of channel phyisiography, where visible at the seafloor, subbottom channel configuration, and acoustic packets of sediments that might represent turbidite deposits. A principal result of this study is that the Astoria Channel/pathway extends continuously from the base of the Astoria Fan southward along the base of the continental slope through the Blanco Valley, then heads southwestward through the Gorda Basin and into the region of the Escanaba Trough. Additionally it was determined that the Astoria Channel is filled and basically buried for it's full length south of 44 degrees latitude. The 44 North Slump, as defined by Goldfinger (1999, see Map 3 ref.), may have been instrumental in blocking the pathway and thus contributed to the filling of the channel/pathway.
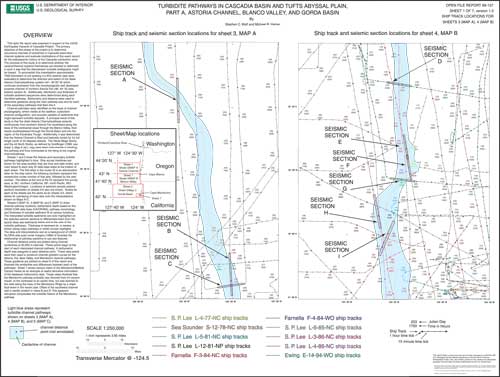
Sheets 1 and 2 show the Astoria and secondary turbidite pathways highlighted in blue. Ship survey tracklines are shown for the area studied; they are time and date coded, and color keyed to each ship ID data base listed at the bottom of each sheet. The first letter in the cruise ID is an abbreviation letter for the ship name, the following numbers represent the consecutive cruise number of that year, followed by the year number. The letters at the end of the ID represent the survey area, ie. NC- northern California, NP- north Pacific. Locations of selected sample seismic sections illustrated on sheets 3-5 also are shown. Scales for each of the sheets are the same as for sheets 3-5, which allows for overlaying of track data onto the interpretations shown on Maps A-C.
Sheets 3 (MAP A), 4 (MAP B), and 5 (MAP C) show channel pathway location, bathymetric depth based on the USGS COW data base (Ca/Or/Wa), pathway morphology, and thickness of turbidite sediment fill at various locations. The interpreted turbidite sediments are color highlighted on the selected seismic sections to differentiate them from the typical deep sea sediments below and to the side of the turbidite pathways. Thickness of sediment fill, in meters, is shown along major pathways in white circular highlights. The data and interpretations rest on a background of USGS GLORIA side scan sonar imagery (1984) to illustrate the relationship of pathway position to sub sea features.
Channel distance points are plotted along channel centerlines at 20,000 m intervals. These points begin at the start of each interpreted channel pathway. A bathymetric depth was assigned to each distance point. These data points were then used to construct channel gradient curves for the Astoria, Eel, Bear Valley, and Mendocino channel pathways. These gradients are plotted on sheet 6 of this report and illustrate the similarities and differences between each of the pathways. Sheet 7 shows various views of the Mendocino/Mattole Canyon heads as an example of useful derivative information of the Seabeam bathymetric data. These views illustrate that the Mendocino pathway probably was directed from it's canyon mouth, to the northwest at an earlier time, but was diverted to the west along the base of the Mendocino Ridge by a major fault event in the recent past. Offset of the southwest channel wall is readily evident in views B and D. This apparent disruption complicates the turbidite history of the Mendocino pathway.

