Open-File Report 99-517
![Figure 2. A, Dashed rectangle (Working Group 1999 box) shows the region included for calculation of earthquake probability and seismic moment. Bold solid lines indicate major faults for which probabilities were calculated. For San Andreas and San Gregorio Fault subsystem, this map shows major fault segments in square brackets (e.g., [NCN], [NCS], etc.; see table 2 for segment names and discussion.) Length of shaded rectangles indicates approximate uncertainty in the position of each segment boundary. Circles show locations from which data have been obtained on the slip or past earthquake behavior of those faults. Localities (circles): AF, Arano Flat; AN, Ano Nuevo; BOL, Bolinas; FL, Filoli; FR, Fort Ross; GF, Grizzly Flat; GG, Golden Gate stepover zone in SAF and SGF; LG, Los Gatos bend in SAF; MB, Monterey Bay bend in SGF; MTJ, Mendocino triple junction; PA, Point Arena; SC, Seal Cove; SCR, Scaramella Ranch; SJB, San Juan Bautista; SUR, Point Sur; VD, Vedanta. For more on Hayward (HF) and Calaveras (CF), and other fault subsystems see text, table 2, and in figures of Section 3.](images/figure2a.gif) |
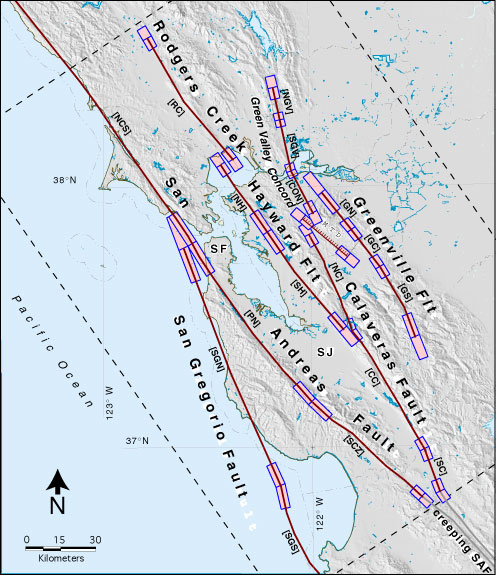
Figure 2. A, Dashed rectangle (Working Group 1999 box) shows the region included for calculation of earthquake probability and seismic moment. Bold solid lines indicate major faults for which probabilities were calculated. For San Andreas and San Gregorio Fault subsystem, this map shows major fault segments in square brackets (e.g., [NCN], [NCS], etc.; see table 2 for segment names and discussion.) Length of shaded rectangles indicates approximate uncertainty in the position of each segment boundary. Circles show locations from which data have been obtained on the slip or past earthquake behavior of those faults. Localities (circles): AF, Arano Flat; AN, Ano Nuevo; BOL, Bolinas; FL, Filoli; FR, Fort Ross; GF, Grizzly Flat; GG, Golden Gate stepover zone in SAF and SGF; LG, Los Gatos bend in SAF; MB, Monterey Bay bend in SGF; MTJ, Mendocino triple junction; PA, Point Arena; SC, Seal Cove; SCR, Scaramella Ranch; SJB, San Juan Bautista; SUR, Point Sur; VD, Vedanta. For more on Hayward (HF) and Calaveras (CF), and other fault subsystems see text, table 2, and in figures of Section 3. |
 |
Figure 2. B, Enlarged view of Working Group 1999 box. |
Figure 1. The threat of earthquakes extends across the entire San Francisco Bay region, and a major quake is likely before 2030. Knowing this will help people make informed decisions as they continue to prepare for future quakes.