U.S. Geological Survey
345 Middlefield Rd MS 975
Menlo Park, CA 94025
Telephone: (650) 329- 4924
Fax: (650) 329-4936
e-mail: dbedford@usgs.gov
dmiller@usgs.gov
We developed custom geologic databases for the City of Rocks so that they can be used in GIS systems with other databases. The datasets have been organized in an ArcView GIS project, a commercial Geographic Information System (GIS) package (Environmental Systems Research Institute, Redlands, California), that simplifies the loading, display, and use of the databases. The database and ArcView project have been developed with the idea that users are not geologists, but do have uses for scientific geologic information. A geologic map database can be plotted on a contour map base to create a standard geologic map. In this mountainous area geology has a strong correlation to terrain, so the geologic map can also be presented as a composite with shaded relief. Maps created from susceptibility models for many geologic processes in the area display areas with potentially high vulnerability to destructive processes such as erosion and rock falls. Physical inventory databases have also been created, such as an inventory of pinnacles and other granitic landforms, and an associated photographic inventory that documents the present state of granitic and related surficial features. The databases are in the final stages of production, as is the development of the ArcView application. Management staff at the City of Rocks has showed strong interest in the database, to be released later this year, and in the ongoing development of scientific research and development of resource applications in the Reserve. The databases will likely be incorporated into an Internet Map Server application that may include virtual field trips and other interpretive information.
At the City of Rocks, geology is a focal point for cultural and natural resources, as well as for recreation. The cultural resources range from the original emigrant routes through late 19th century settlements and the subsistence lifestyles of the early American west. Emigrants took note of the area because of the pinnacles and abundance of water, both being attributes of the geology that formed the Albion Mountains. Members of early communities adapted their lifestyles to the offerings of the land, whether availability of clay for brick making, stone for building, or water for irrigating. Geology has a fundamental influence on natural resources as well, since the geology controls landforms, and these landforms influence the plant and animal communities. Geological features are also noted for their recreational values. The eroded granitic terrain harbors a maze of spires, which are popular among climbers. However, the granitic sediments of the area are not able to withstand many land-use practices, resulting in eroding sections of trails and roads and diminishing wildlife and vegetation.
The geologic database consists of an Arc/Info (Environmental Systems Research Institute, Redlands, California) format dataset that represents bedrock and surficial deposits for the City of Rocks. Geology was mapped at 1:24,000 scale and larger when necessary. Much of the recent mapping was done using GPS and in-field databases to improve accuracy and increase efficiency of mapping. The digital field systems used for much of the mapping consists of a PLGR GPS unit with an average 8m locational accuracy, and a PalmPilot handheld computer running a database package which serves as the geologist's notebook. Because notes and positional information are acquired digitally and accurately, they allowed daily mapping information to be downloaded into a laptop computer at the end of each day and incorporated into a spatial database of observations. Nightly updates to the geologic map were performed using the daily observations and Digital Orthophoto Quadrangles in ArcView GIS, using ArcView's on screen digitizing capabilities for shapefiles. When mapping was completed, the geologic map was imported into an Arc/Info database, and topological errors inherent in shapefiles were corrected. The database consists of a geologic units and faults layer, structural layer, and cross-sections; all are viewable in ArcView or other GIS packages.
|
Figure 1. Flow diagram illustrating the Geologic Susceptibility Models. |
The basic form of each model is a series of geologic, terrain, and climatic factors that are numerically modeled to create an output susceptibility map. Input factors are individually weighted to classify each factor into an appropriate scale (for instance, slope is continuously changing data, but there may be threshold slope values that need to be expressed in the models). Individually weighting each factor in the model also puts all the data into the same range of values. This is important in order to numerically compare factors: if a geologic unit is "late Pleistocene alluvium", and you want to model the slopes on that unit, you have to convert a text attribute into a numerical attribute. Similarly, to compare erosion potential between bedrock units and surficial units, the units must be weighted against each other so that surficial units will be more susceptible to erosion. Each factor is classified and assigned numerical values based on theoretical and experimental studies from the literature, from knowledge of geologic processes, and from inferences based on geologic deposits and other information at the Reserve. Once each factor is individually weighted and in the same range of values, an equation can be developed that weights each factor against the others. This equation is then evaluated on a pixel-by-pixel basis to arrive at the final result, which is classified by inspection and calculation into categories of high, medium, and low susceptibility and displayed in map form. Figure 1 illustrates this process. Although the models are essentially empirical, they yield numerical results that can be used to test and calculate statistical measures of suitability, should those approaches be desirable.

Figure 2. Sample susceptibility map showing the reserve boundary and roads in the Reserve. |
The pinnacles and granitic landforms database represents outcrops of granite features with abrupt topographic relief on one or more sides, as distinct from exposed pediment and other nearly flat granite features. The location of pinnacles were "heads-up" digitized using ArcView GIS, and then converted into Arc/Info format. Digital Orthophoto Quadrangles of the Reserve were used as a base for digitizing the polygonal outlines of the bases of pinnacles within the Reserve. Stereoscopic viewing of multiple years of aerial photographs (1956 - 1992) aided in distinguishing granite features of raised relief from exposed pediment and rock fall. Digitizing was done at variable scales from 1:3,000 to 1:10,000. Field checking was performed in many areas during the photographic documentation of granitic rock features.
A spatial inventory of location of granite rock outcrops having raised relief can be used for a variety of purposes, including base map applications and spatial analysis in a GIS. Base map applications include: identifying and locating (1) rocks with names, (2) pinnacles used for climbing, (3) rocks bearing inscriptions, and (4) rocks with unique, rare or fragile features. The database can also be used to: (1) prepare thematic maps (or pamphlets) using prominent pinnacles as selected reference points, (2) reference features or landmarks on trail maps or climbing guides, (3) prepare road maps, and (4) aid in search and rescue operations. Below we describe its use in a rock and fragile feature inventory.
This digital database can be used in ArcView, or other GIS packages, to query for relationships with other GIS datasets for interpretation, resource management, maintenance, and design & development applications. This dataset can also serve as a base map for baseline inventory of other resources (e.g. wildlife habitat; pack rat midden localities; inscription rocks; climbing rocks, etc).
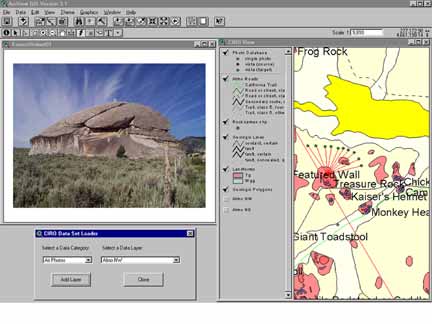
Figure 3. Screenshot of photographic database in use. |
Photographs were taken using a digital camera and aerial photographs and topographic maps were used to note the location of each photo. A short description of the features seen in the photograph was incorporated into the database, as well as common keywords that can be attributed to many photographs to allow ease of querying the database for a particular theme found in the photos. The photographic database is implemented in ArcView through the use of hotlinking: when a user clicks on a point or points in the photographic database, all photos associated with that point are automatically loaded into separate windows within ArcView. Further modifications to the ArcView project will probably automatically load the description of the photo as text at the bottom of the image. Currently there are over seven hundred photos in the photographic database, including repeat photography from the 1970's and again in the late 1990's. Another research project in the Reserve was the professional photography of nineteenth and early twentieth century rock inscriptions by the many emigrants through the City of Rocks. This database, not presently in a GIS, accentuates the inscriptions and special filtering has allowed the analysis of the inscriptions, some of which aren't visible to the naked eye. The database of inscription photography could also be incorporated into a GIS because we have provided a spatial database of rocks on which these inscriptions are found.
The purpose of the inventory and photographic database of special features is to document the location and current status of features considered to be fragile in the Reserve. By incorporating photography, land managers will be able to visually inspect the current conditions of these features, and in the future, will be able to analyze the changes that have occurred on these landforms. The photographic inventory provides a baseline for analysis, so that qualitative, and possibly quantitative, analysis of the degrees of impact or recoverability to these landforms will be possible.
Cunningham, F.C., 1971, The Silent City of Rocks, a bornhardt landscape in the Cotterrel Range, south Idaho, USA: Zeitschrift fur Geomorphologie, v. 15, p. 404-429.
|
Return to Table of Contents
This site is https://pubs.usgs.gov/openfile/of99-386/bedford.html
|