By T. Wayne Furr
Oklahoma Geological Survey
Norman, Oklahoma 73019-0628
Telephone: (405) 325-3031
Fax: (405) 325-7069
e-mail: twfurr@ou.edu
The Oklahoma Geological Survey (OGS) has maintained a strong commitment to mapping the geology and natural resources of the State of Oklahoma; a commitment that began before statehood with its predecessor organization, the Oklahoma Territorial Geological Survey. In 1904, before becoming the first State Geologist, Dr. Charles N. Gould, prepared a preliminary geologic map of the Oklahoma Territory. Three years later, Gould contributed to the development of the enabling act for the creation of the state geological survey. When comparing length of service to other state geological surveys OGS may be considered an infant. However, OGS claims the distinction of being the only state geological survey in the nation to have been created under a directive of the constitution of a newly formed state.
The objectives and duties of the new survey were defined by Oklahoma's First Legislature. Senate Bill No. 75 provided for a study of the geological formations of the State with special reference to its mineral deposits, including the preparation and publication of reports with maps. The reports are to provide both general and detailed descriptions of the State's geological resources.
The first full-color geologic map of Oklahoma, compiled by Hugh D. Miser of the U.S. Geological Survey (USGS), was released in 1926. After 20 years of use, the map not only was outdated it was out of print as well. In 1947, Miser returned to Norman to supervise revision of the 1926 map. Miser and 10 additional authors are given credit for the geologic map of Oklahoma that was released in 1954 (Ham, 1983, p. 7). Forty-five years later the map is still in use, but in need of major revisions. Mapping and other kinds of field studies have continued with the completion of 145 Bulletins, 100 Circulars, 35 Mineral Reports, 31 Guidebooks, 5 Educational Publications, 35 Geologic Maps, 9 Hydrologic Atlases, 65 Special Publications, and 45 Open-File Reports.
For more than 70 years, county mapping has been the cornerstone of geological investigations at OGS. Kay County, located in north-central Oklahoma is the most recent to be mapped. Currently, geologic investigations are underway in the western part of Osage County. Traditionally, investigations in the county geological mapping program have been produced in the Bulletin and Circular Series with maps at a scale of 1:63,360.
Recent resource mapping in Oklahoma has focused on the coal reserves and environmental problems associated with past mining, including poor reclamation techniques. The principal user of the OGS coal-resource maps is industry. Several mines in the State have been developed based on information provided from these studies.
Beginning in 1985, a program to map the northern part of the Ouachita Mountains fold-and-thrust belt and the southern part of the Arkoma foreland basin was conducted. Designed to support natural-gas exploration and coal development, and to reduce associated environmental hazards, 22 geological-quadrangle maps were produced. In 1998, OGS shifted new mapping efforts to the northern Oklahoma City metropolitan area. Twelve 7.5-minute quadrangles were selected, with completion expected by July of the year 2000. The purpose of this mapping is to provide area planners with detailed geologic maps that will enable them to make informed decisions with regard to aquifer protection, resource development, and highway construction.
In late 1994, the Oklahoma Geologic Mapping Advisory Committee (OGMAC) recommended that OGS prepare a series of geologic maps at a scale of 1:100,000 for the entire State using digital technology. The purpose of the maps is to provide a Geographical Information System (GIS) geologic data base for industry, public officials, area planners, and other interested parties. In addition, this series will provide the foundation for a new 1:500,000-scale geologic map of the State. Maps in this series are compilations of geologic investigations from various sources, with field checks used to fill gaps found in prior investigations and improve on earlier mapping efforts.
Partial funding for the OGS geological mapping activities has been provided under two separate grants. From 1985 to 1993, mapping was funded through the COGEOMAP Program, an agreement between the OGS, the Arkansas Geological Commission, and the USGS. Since 1994, geologic mapping has been funded through the STATEMAP component of the National Cooperative Geologic Mapping Program.
In September 1996, OGMAC recommended that OGS concentrate on the Oklahoma Panhandle. The mapping will complement ongoing studies in the area conducted by the Oklahoma Water Resources Board and Water Resources Division of the USGS. Investigations by each agency will provide a better understanding of environmental issues associated with an increasing transportation infrastructure, numbers of feed lots, and meat-processing plants. OGS geologists started compiling the geology in the westernmost quadrangle in 1997. The digitizing, GIS-attributing, and cartographic production has essentially been completed on the Boise City Quadrangle. Completion of the Guymon and Beaver quadrangles is expected by the end of June 1999 (figure 1).
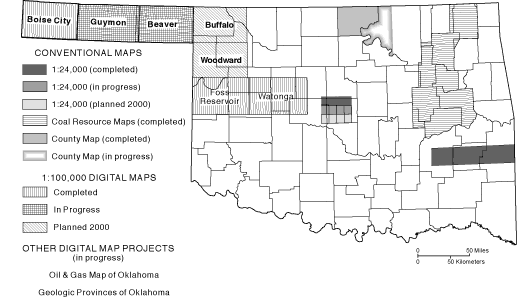
Figure 1. Index to 1:100,000-scale geologic maps in Oklahoma.
II. OGS Cartographic Staff
III. GIS Specialist
In addition to the GIS format, Dr. Charles J. Mankin, Director of OGS, expressed the need to publish each geologic quadrangle in full color for release in our Geologic Map Series. Having two different types of digital products presented a different set of problems. The biggest complaint expressed by reviewers of printed GIS maps was graphic presentation. They expected to see standard geologic colors, lettering, and other symbols. Unfortunately, graphic presentation has never been a strong point in most GIS programs. Another problem was converting the GIS files to a publishable format. A GIS is an analysis tool designed to evaluate a range of possible scenarios. By evaluating different possibilities, a course of action can be considered before irrevocable mistakes are made in the landscape itself (Burrough, 1986, p. 7). In other words, a GIS was never intended to be the computer toolbox for designing, drafting, and printing maps in the traditional way. As a result, from the GIS file format, it is difficult to provide to the printing industry a digital file that is compatible with the industry's graphic-output devices.
These problems and others have been addressed by agencies that have tried to use a GIS as a publishing tool. In checking with other state geological surveys, private cartographic firms, pre-press, and printing companies, the answers are not entirely clear. Many agencies use Macintosh computers, others use PCs with a variety of operating systems, and others use UNIX-based workstations. A multitude of software was also found to be in use. Some were using one of several GIS programs, some were using CAD programs, while others were using a variety of graphic software programs. The pre-press and printing firms were not familiar with GIS file formats, but preferred to use files created in Adobe Illustrator.
The OGS Cartographic Section's computer setup consists of Pentium II PCs with Windows NT operating systems. Software includes Microsoft Office, ArcView 3.0a, and Adobe Illustrator 7.0.1. One problem that had to be addressed was how to import GIS files to Illustrator while maintaining the GIS attributing. For this operation, third-party software was needed to bridge the gap between ArcView shapefiles and Adobe Illustrator. The third-party software chosen was MAPublisher from Avenza Software. MAPublisher is a cartographic-geographic information system for integrating GIS files directly into Adobe Illustrator while maintaining the GIS attributing. The plug-in filters allow the cartographer to consider map projections, scale, color, and necessary cartographic operations, while maintaining the GIS functionality. The completed map project can be saved in one of the many formats used by the pre-press and printing industry. In addition, map layers can be exported as shapefiles for use in a GIS.
Future mapping will include additional 7.5-minute quadrangles in the Oklahoma City area and 1:100,000-scale quadrangle(s) in western Oklahoma. Additional projects being considered for production in both digital and publishable formats are the Oil and Gas Map of Oklahoma at a scale of 1:500,000, the Geologic Province Map of Oklahoma at a scale of 1:750,000, and the expanded revision of Educational Publication 1. In addition to the geologic mapping programs, an inventory of all geologic maps published by OGS is being compiled and entered into the National Geologic Map Database <http://ngmdb.usgs.gov>. As a state agency, the Oklahoma Geological Survey has made a commitment to meet the needs of the State's citizens by providing high-quality printed maps, as well as GIS data bases of the State's geological resources.
Furr, T.W., Gregory, M.S., and Suneson, N.H., 1998, Oklahoma Geological Survey's (OGS) digital geologic maps (abs.): Geological Society of America Abstracts with Programs, v. 30, no. 3, p. 6.
Ham, E.A., 1983, A History of the Oklahoma Geological Survey 1908ń1983: Oklahoma Geological Survey Special Publication 83-2, 60 p.
|
Return to Table of Contents
This site is https://pubs.usgs.gov/openfile/of99-386/furr.html
|