
Digital Mapping Techniques '99 -- Workshop Proceedings
U.S. Geological Survey Open-File Report 99-386
"Can't See the Geology for the Ground Clutter" - Shortcomings of the Modern Digital Topographic Base
By David J. McCraw
New Mexico Bureau of Mines and Mineral Resources
New Mexico Institute of Mining and Technology
801 Leroy Place
Socorro, New Mexico 87801
Telephone: (505) 835-5487
Fax: (505) 835-6333
e-mail: djmc@nmt.edu
ABSTRACT
Digital base map data of modern geologic maps must conform to the requirements of the National Spatial Data Infrastructure by containing the following framework data layers: transportation, hypsography (elevation data), hydrography, political units (boundaries), geodetic control, and a cadastral reference system (e.g., PLSS). At the onset of digital mapping a decade or so ago, overall quality of digital base data was quite poor compared to the non-digital, photographic plates previously used in traditional cartographic methods, and it has never adequately improved. These digital geographic base data are currently available from the USGS in four basic formats: DOQs, DEMs, DLGs, and DRGs. DOQs and DEMs are best utilized in conjunction with DLGs or DRGs due to a lack of several types of framework data. Only the DRG contains all necessary framework elements, yet it is not available in high resolution. A case study from a high relief area with a small contour interval clearly illustrates the overall poor quality of this scanned data. All four datasets require extensive modification prior to incorporation into the geologic map. The best solution at present is to generate in-house DRG data by scanning photographic plates at much higher resolution and rubber-sheeting the raster image around the sixteen basic grid control points in Arc/Info.
INTRODUCTION
A geologic map is of little use to anyone if it is not in some manner "grounded" to its appropriate location on the earth by registering it to the topographic base map. At the very least, it must be projected to a known geospatial coordinate system (Universal Transverse Mercator, or UTM, latitude and longitude, etc.), perhaps with an adjacent north arrow, before any scientific editor would consider it acceptable for publication. More importantly, I would argue that the geologic map of the late 1990s should be in compliance with the National Spatial Data Infrastructure (NSDI) and contain essential thematic framework base data on which information (geologic or otherwise) can be accurately assimilated, registered, and integrated. Of the eight themes of geographic data recognized by the Federal Geographic Data Committee (FGDC) as "the Framework," the base of any geologic map should contain the following layers: transportation, hypsography (elevation data), hydrography, political units (boundaries), geodetic control, and a cadastral reference system (e.g., PLSS). Digital orthoimagery often provides a dramatic backdrop upon which to display geologic data if the data aren't too "busy." Cadastral land ownership, of all of the framework elements, seems the least important to the geologic mapper. However, in New Mexico, where Indian pueblos and sovereign tribal lands make up almost 20% of the total land area of the fifth largest state of the Union, this is significant geographic data that should be included.
While all of this might seem implicit and rather unnecessary to raise as an issue in a forum of geological mapping professionals, I feel that, to date, this subject matter has not been adequately addressed. In the days of pre-digital cartography, base materials were most often acquired as photographic negative plates from the USGS and then manually manipulated by the cartographer to fit the map as needed. Little thought was given to the types of data presented. The requirement of the base was simply to provide an adequate means of location. With the digital revolution, cartographers quickly began utilizing a wide variety of hardware and software to expedite the map-making process. While in-house map production time was greatly reduced, problems involving file and data sharing grew considerably. Indeed, in response to this, the NSDI was established in 1994 by President Clinton's Executive Order 12906.
At the onset of digital mapping, overall file size was perhaps the most important consideration in practical digital map production. Base data quality suffered greatly in an attempt to keep file sizes manageable, when compared to those non-digital base data previously utilized. This was an acceptable trade-off to the overwhelming amount of time and effort saved. Today, with advanced technology and faster computers, base data quality continues to suffer, unnecessarily. Base data underpinning geologic maps commonly lack one or more framework elements, are often illegible (either due to poor resolution or from having type or linework set over base information), inaccurate (due to outdated data, a lack of geodetic control, a misregistration of the base data, or some combination thereof), or both. Problems of this nature often result from the inadequate quality of the digital data available. At present, all digital base data require some level of modification to comply with NSDI prior to adding geology. In this paper, I compare and contrast these various digital data and highlight some of their shortcomings.
TYPES OF DIGITAL TOPOGRAPHIC BASE DATA AVAILABLE
Unless geologic cartographers intend to produce their own base data through extensive GPS-surveying and/or manipulating some other remotely sensed data such as airborne radar, they are left with four basic types of digital geographic data currently available from the USGS: digital orthophoto quadrangles (DOQs), digital elevation models (DEMs), digital line graphs (DLGs), or digital raster graphics (DRGs). The USGS National Mapping Division (NMD) defines these datasets as follows:
DOQ - a digital image of an aerial photograph in which displacements caused by the camera angle and the terrain have been removed. They combine the image characteristics of a black and white, color, or color infrared photograph with the geometric qualities of a UTM projection map based on the North American Datum of 1983, and have a 1-meter ground resolution.
DEM - a digital record of terrain elevations for ground positions at regularly spaced intervals primarily derived from published USGS topographic maps.
DLG - these are spatial representations of planimetric information using points, lines, and areas. Currently, the USGS DLG data are distributed as level 3 data (DLG-3), indicating that the data contain a full range of attribute codes, have full topological structuring, and have passed extensive quality-control checks.
DRG - a scanned raster image of a USGS topographic map whose data, inside the map neatline, is georeferenced to the surface of the earth. The raster data have been scanned at either 200 or 250 dots per inch (dpi).
Of these, only the DRG provides the cartographer with all of the framework themes. Yet, given their poor resolution and low quality, cartographers are hesitant to use this product. As stated above, all four types of digital base data must be in some way manipulated and/or combined to generate an accurate, clearly legible, and aesthetically pleasing base upon which to drape a geologic map. Tables I and II summarize the advantages, disadvantages, and necessary modification requirements for each of these datasets.

Very effective base maps can be constructed by combining a DOQ or a DEM with a DLG-3, if any or all of its framework layers are available, but place names and symbology must be added. Combining a DOQ or a DEM with a DRG will also provide effective base coverage if the topographic map data the DRG contains has a suitable contour interval and the data is cleanly sampled. DLG-3s, again, where available, have the advantage of being updated and manipulated because of their vector format, whereas DRGs ultimately only capture the time in which the original paper map was produced. Unfortunately, due to the linear nature of DLG-3s, the data often contain artificial straight line segments and "jaggies," non-smooth, jagged departures from true curves at junctions between straight line segments.
DLG-3 VS. DRG CASE STUDY: PLACITAS, NM 7.5-MINUTE QUADRANGLE
The cartographer, to provide NSDI compliant base data, must rely on either the DLG-3 or the DRG. In areas of complex topography with high relief and a small contour interval, neither digital dataset is adequate. To illustrate this, I present below a case study of a small area of high relief in the Placitas, NM 7.5-minute quadrangle, underlain by a complex Paleozoic and Proterozoic geology.
Methods
Transportation, hypsography, hydrography, and PLSS DLG-3 layers were imported from SDTS into Arc/info format. (Only elevation data is found in the study area depicted below.) In the interest of time, contour labels were left off. Labeling contours with the proper italic font, point size, and appropriate line break distance is a time-consuming task in Arc/Info. The resulting data was exported as a TIFF, imported into Adobe Photoshop, converted to grayscale, and sampled at both low (72 pixels/in, roughly equivalent to dpi) and relatively high (600 pixels/in) resolution. Areas of green color on the DRG were rendered white, hachured inundation areas and areas of urban purple and gray screen tints were removed. The image was then converted to both bitmap (1 bit data) and grayscale (16 bit data) and sampled at 72 and 600 pixels/in (Figure 1).
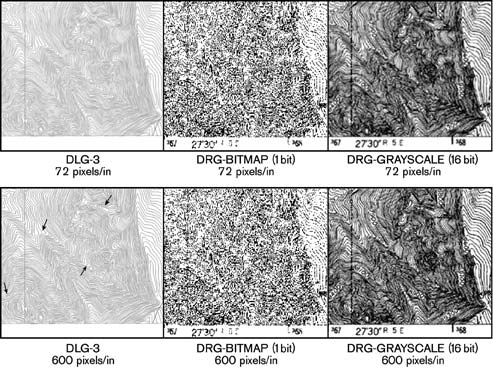
Figure 1. Comparison of DLG-3 base data to DRG base data for a small area of the Placitas, NM 7.5-minute
quadrangle depicted at 150% at low and high resolution. Arrows point out several jagged
straight line segments common in DLG-3 data.
Results
The data depicted in Figure 1 are discouraging. The DLG-3 data at high resolution gives the greatest clarity but the linear nature of the data is often obvious and "unnatural." The DRG data clearly shows how black pixels representing lines converge, creating an overall blurring effect, as to render the data essentially useless. The low resolution of the initial 250 dpi scan of the paper map is apparent and cannot be fixed, unless done so pixel by pixel in Adobe Photoshop or comparable software.
SO WHAT DO WE DO?
If we are in the business of making geologic maps and are therefore necessarily too busy making geologic maps to have to additionally make the accompanying digital base map, we have three basic options. (1) Nothing/As Little As Possible. In this scenario we utilize either the DLG-3 or DRG, perform as little modification as necessary and accept the limits of our data. (2) Beg. In this case we implore the National Mapping Division of the USGS to seriously consider the end users, with their modern, powerful, hard drive space-rich computers and re-scan the >55,000 7.5-minute quadrangles of the U.S. at a resolution of at least 600 dpi, a level currently accommodated by most output devices. Why not ask for the data in separates as well? (3) Fall Back On Memories Of Pre-digital Cartography. At the New Mexico Bureau of Mines and Mineral Resources, we initially order and purchase photographic composite negatives from the USGS-NMD (these are also used to make greenlines). Contract services are obtained to make photographic contact positive prints (we no longer own a Photo Mechanical Transfer camera, having surplused it at the onset of the digital age), and further contracts are made to generate a single 100% TIFF scan of the photographic positive image at the highest resolution possible, as 16 bit data. We are currently able to acquire scans locally at 400 dpi. The scanned raster data is then "rubber-sheeted" about the 16 standard grid control points in Arc/Info to remove distortion, and transported to Adobe Photoshop. The image quality can then be significantly improved by using sharpening filters and adjusting spectrum levels prior to conversion to bitmap. In such a manner we create our own DRG data, at a total cost of $120 for the negative, the film work, and the scan. As seen in Figure 2, the quality of the data is far superior to the USGS 250 dpi DRG data, even at only 400 dpi.
Figure 2. Scanned TIFF image of contact print made from photographic composite negative obtained from
USGS-NMD (image at 200% size compared to those of Figure 1). Contact print was scanned at 400 dpi
and sampled at 600 pixels per inch.