Montana Bureau of Mines and Geology
Montana Tech of The University of Montana
Butte, MT 59701-8997
Telephone: (406) 496-4379
Fax: (406) 496-4451
e-mail: lsmith@mtech.edu
ssmith@mtech.edu
In the seven years that digital geologic maps have been constructed at the Montana Bureau of Mines and Geology (MBMG) using Arc/Info, a major problem has been providing base information that makes the maps more useful. Because of cost considerations, very few geologic maps are being produced by offset printing. In the past few years, most maps have been released as open-file reports. We are moving toward producing these, and possibly additional map series, as plot-on-demand digital products.
The current fundamental mapping scale at MBMG is 1:100,000. In the past few years, digital line-graph data of cultural features and water and digital public land survey system data became available at several mapping scales. However, the most important base feature for geologic maps is topography. To date, we have used three different techniques to add topographic data to digital geologic map products, each of which has associated advantages and problems: (1) mechanical topographic contours, (2) raster topographic contours, and (3) digital hillshade relief. The methods, problems, and successes of these different approaches are summarized below.
(1) Mechanical topographic contours: A blackline mylar plot of the geologic arcs and labels is overlain on a blackline mylar of a U.S. Geological Survey (USGS) topographic quadrangle to produce a sepia mylar from which diazo prints are made. This method is a holdover from our previous printing methods for production of open-file maps (Figure 1A). Major problems with this approach are: (a) having to use a large vacuum frame and separate light source rather than our roller-drive diazo print machine; (b) needing screened mylars of all topographic quadrangles; (c) the need for linework to be relatively heavy for adequate reproduction quality, and (d) the resulting lack of a colored product. We never fully carried out this procedure.
(2) Raster topographic contours: A raster representation of a USGS topographic quadrangle is acquired from a digital raster graphic (DRG) file or by in-house scanning (usually at 400 dpi) of a mylar of the USGS topographic quadrangle. The image is then layered with geologic data. The topographic data from DRG files need some processing to strip out some colors, change the colorizing scheme to shades of gray, and turn the white areas transparent. The raster data are rectified in Arc/Info, on our Unix system. Image processing is done on personal computers using Adobe Photoshop and Macromedia Freehand. Geologic data have been added with or without colored polygons. Our current approach is to overlay colored polygons with gray-scaled topographic data, and then put geologic arcs and annotations in black over the other layers, and to print the product on our 360 dpi inkjet plotter (Figure 1B). The main problems with the products are (a) the busyness of the maps where unit labels and other data are superimposed on base data, and (b) the lack of contrast between some polygon colors and the gray topographic base data. These color maps are more useful than maps with blackline geology on blackline topography of method (1), but lack some of the crispness and readability of maps produced with vector basemap data.
|
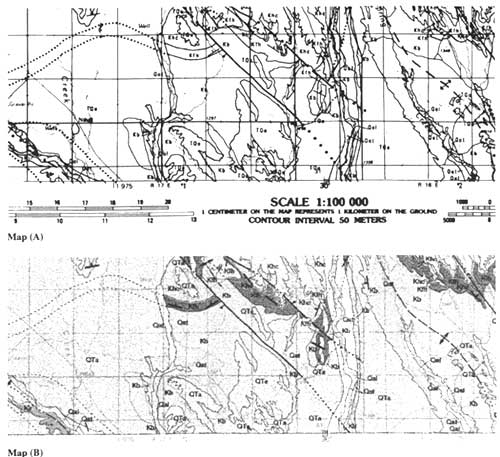
Figure 1. Examples of geologic maps produced by two methods of adding topographic data to geology layers. Contacts, faults, and axial traces of folds are shown by solid or dashed lines; concealed contacts, faults, and axial traces of folds are dotted. The grids are sections in the public land survey system. |
|
Map (A) Example of a sepia mylar used to make diazo prints of Open-File Report, using method (1) to supply topographic contour and geologic data. Note that (a) the thick line weights required by the diazo print process make for poor definition between geologic and base data, and (b) the general busyness of the map.
Map (B) Gray-scale plot of a color print, made from a 360 dpi inkjet plotter, showing results of method (2). Gray-colored base data, on the original print, are on top of the colored polygons, but beneath the black arcs and annotations. Resolution of some of the base data is poor; some of the labels on the base are illegible. There is an overall decrease in the busyness of the linework in comparison to Map (A). |
(3) Digital hillshade relief: A gray hillshade image produced from a digital elevation model (DEM) is combined with the geologic coverage to produce a shaded-relief geologic map. The hillshade is constructed in Arc/Info from available DEM's (mostly 30 m data with artifacts in western MT and three arc-second data in eastern MT). Filtering and vertical exaggeration of the elevation data are typically used. Topographic and geologic data are composited as grids, producing three grids in the hue-saturation-value model, which allows for lightening or darkening of the image when a graphics file is created (Renaud, 1994). Where adequate DEM data are available (currently only in western MT), the products make visually striking displays that show geologic data in a highly understandable format. However, the lack of topographic contours hinders geologic applications that require quantitative elevation data.
Ideally, at a minimum we hope to print and provide digital versions of our geologic maps with contour bases; we hope also to provide hillshaded topographic bases, depending on the needs of the customer. Acquisition of raster topographic contour data that is legible at map scales is a surmountable problem; acquiring similar vector data is more of a problem. Method (2) will likely be used to produce our normal products. The enthusiastic reception we have received for geologic maps on shaded relief topographic bases encourages us to continue to produce these products.
|
Return to Table of Contents
This site is https://pubs.usgs.gov/openfile/of99-386/smith.html
|