
Digital Mapping Techniques '99 -- Workshop Proceedings
U.S. Geological Survey Open-File Report 99-386
Acquisition of Geologic Quadrangle Data from a Digital Index Map -- A New ArcView Application to Geologic Data Query
By Xin-Yue Yang, Warren H. Anderson, Thomas N. Sparks, and Daniel I. Carey
Kentucky Geological Survey
Room 228, Mining and Minerals Resources Building
Lexington, KY 40506
Telephone: (606) 257-5500
Fax: (606) 257-1147
e-mail: xyang0@pop.uky.edu
INTRODUCTION
The Kentucky Geological Survey (KGS) is currently in the process of converting a statewide set of geologic quadrangle (GQ) maps to digital format (Anderson, 1998). Since geologic maps are usually highly detailed and complicated, the KGS devised a standardized procedure for GQ data capture and attribution, in which data for a particular quadrangle are segregated into multiple Arc/Info data layers based on the nature of the geologic data (Anderson and others, this volume). For each GQ, lithologic formations, structure contours, mineral resources, faults, coal resources, fossils, drill holes, and igneous dikes are captured and attributed as separate coverages or data layers. Each data layer may consist of one or more feature data types (e.g., polygon, arc, or point). These coverages are stored under an Arc/Info workspace named after the quadrangle. There are 707 geologic quadrangle maps that cover Kentucky. Eventually, the KGS digital GQ database will contain 707 Arc/Info workspaces and several thousand Arc/Info coverages. Therefore, populating data from this spatial database for map manipulation is an important issue. So that users of the digital GQ database will not have to browse through the database to find particular coverages, and then load them one by one, we introduce a new ArcView application, called GQ Data Query, that acquires spatial geologic data from a spatial database through an interactive index map.
Figure 1. Algorithm and implementation of GQ Data Query.
|
ALGORITHM OF GQ DATA QUERY
GQ Data Query can significantly automate access to, and display of, digital GQ data. It allows a user to load geologic data for any quadrangle by selecting that quadrangle in a digital index map. The algorithm of GQ Data Query is analogous to acquiring a paper GQ map from an organized map storage. The algorithm can be illustrated as the following basic steps: (1) locate a quadrangle by selecting the polygon that represents the quadrangle on the index map, (2) retrieve the quadrangle name by accessing the attribute table of the index coverage, (3) identify the data source where the Arc/Info workspace for the selected quadrangle is located, (4) identify all existing Arc/Info coverages under the workspace, and (5) extract and display all the Arc/Info coverages under the workspace (Fig. 1).
Developed through the Avenue scripting language, GQ Data Query consists of the following major components: a 7.5-minute index map coverage, an external database file that stores the metadata for all individual quadrangles, and a set of Avenue scripts. The Avenue scripts are customized to associate with a button and the Load Data menu under View in the standard ArcView 3.1 interface, so that a user will be able to load all geologic data pertinent to a selected quadrangle by either pushing the button or selecting the menu. The database file is used to link the polygon attribute file of the index polygon coverage to form a virtual table, which then serves as a linkage between the index coverage and the actual GQ data. A user can also obtain metadata for any particular quadrangle through the virtual table, such as quadrangle name and number, latitude and longitude, publication date, and author name. If the index map is overlaid with other coverages such as county boundaries and road networks, a user will be able to identify the spatial relationship between a quadrangle, road network or county area.
EXAMPLE
Figures 2 and 3 illustrate a typical working session of GQ Data Query. When the ArcView project is opened, a 7.5-minute index map is displayed. On the index map, some quadrangles are highlighted initially to indicate that digital geologic data for these quadrangles are currently available (Fig. 2, top). The desired quadrangle can be selected either through query by using the Query Builder (by name or map number) or through mouse click after zooming in (Fig. 2, bottom). After a quadrangle is selected on the index map, the geologic data can be loaded simply by pushing the Load GQ Data button or selecting Load Data menu (Fig. 3, top). If users want to extract data for multiple quadrangles, they will be given an option to populate data on an existing view if quadrangles are adjacent to each other (Fig. 3, bottom) or create a new view.
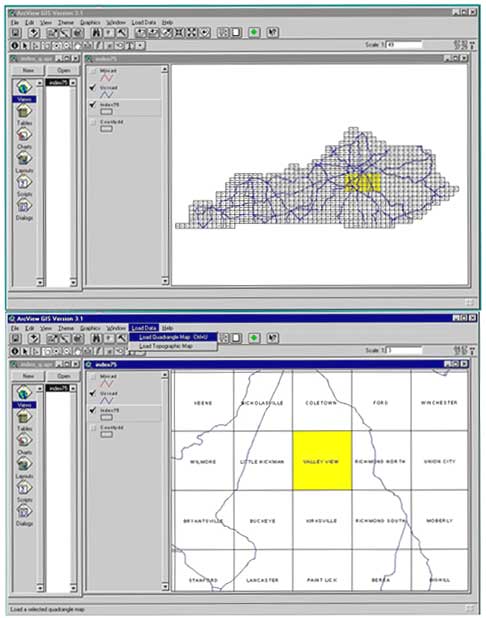
Figure 2.A typical working session of GQ Data Query:
(top) an interactive index map as a graphic interface of ArcView GIS; (bottom) select a quadrangle on the index view.
|
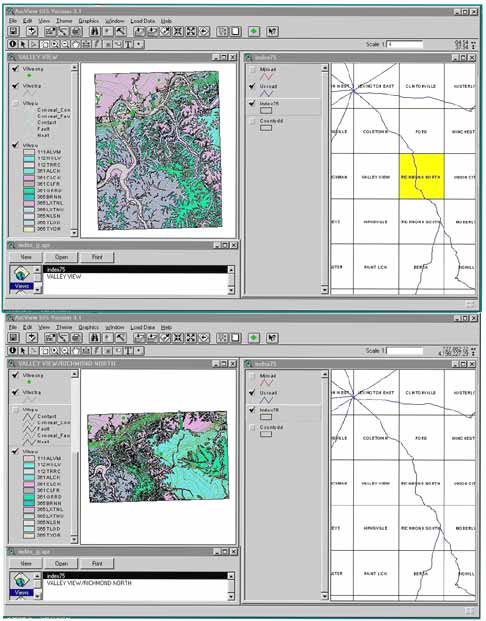
Figure 3. A typical working session of GQ Data Query (continued): (top) loading a geologic quadrangle; (bottom) loading two adjacent quadrangles.
|
REFERENCE
Anderson, W.H. 1998, History of geologic mapping at the Kentucky Geological Survey, in Soller, D.R., ed., Digital Mapping Techniques ë98-Workshop Proceedings: U.S. Geological Survey Open-file Report 98-487, p. 9-12, https://pubs.usgs.gov/openfile/of98-487/anderson.html.