The surficial geology of an 11 by
15 km section of the inner continental shelf off Sarasota, Florida has
been mapped. The map area extends  from Sarasota Point to Buttonwood Harbor and offshore between approximately
3-m and 13 m water depths (Fig. 1). The study is part of a larger program
initiated by the U.S. Geological Survey
to map the geologic framework and monitor modern processes that affect
the western Florida coastal zone. This survey, and a second one off Indian
Rocks Beach (Harrison, 1996), provide insights into the local variability
of the surficial geology that cannot be obtained from the regional studies.
The U.S. Geological Survey, in cooperation with the
University
of South Florida and Eckerd
College, completed a bathymetric, sidescan sonar, high-resolution
seismic-reflection, and surface sediment sampling survey of this inner
shelf environment during May, 1995.
from Sarasota Point to Buttonwood Harbor and offshore between approximately
3-m and 13 m water depths (Fig. 1). The study is part of a larger program
initiated by the U.S. Geological Survey
to map the geologic framework and monitor modern processes that affect
the western Florida coastal zone. This survey, and a second one off Indian
Rocks Beach (Harrison, 1996), provide insights into the local variability
of the surficial geology that cannot be obtained from the regional studies.
The U.S. Geological Survey, in cooperation with the
University
of South Florida and Eckerd
College, completed a bathymetric, sidescan sonar, high-resolution
seismic-reflection, and surface sediment sampling survey of this inner
shelf environment during May, 1995.
Geologic Setting
The West Florida coastline is divided into three major coastal geomorphic provinces: the Big Bend marsh coast to the north, the barrier island coast off the central part, and the Ten Thousand Island mangrove coast off southern Florida (Davis et al., 1992). This study area lies off the barrier island coast. The bedrock in this area is the Miocene aged Hawthorne formation, a phosphate-rich limestone and dolostone (Davis et al., 1989) while, by contrast, the beaches and the surface sediments of the inner continental shelf are largely siliciclastic sand. The outer shelf, however, is almost entirely covered by carbonate sediment as is the inner shelf to the north in the Big Bend area and to the south in the Mangrove coast area (Gould and Stewart, 1956; Doyle and Sparks, 1980). The siliciclastic sediments that compose the barrier islands and inner shelf of central West Florida coast are relict, having been derived from the Appalachians during the Neogene by fluvial and longshore processes (Davis et al., 1992). Subsequently, these sands were redistributed across the shelf by the numerous transgressions and regressions of sealevel during the Quaternary (Davis and Hine, 1989; Hine, 1996). At present, much of this siliciclastic sand is stored in Pleistocene aged beach ridges on land, in the modern barrier beach system, and to a lesser extent as a discontinuous, thin, sand sheet on the inner shelf (Davis and Klay, 1989).
The West Florida shelf is a low energy environment. This is a microtidal coastline with the tide range not exceeding 0.5 m (Tanner, 1960). Tidal currents can be strong in the tidal inlets where megaripples and larger sand waves often are present, however, on the continental shelf the tidal currents rarely exceed 15 cm/sec (Harrison, 1996). Waves are generated by hurricanes and other tropical depressions as well as by northwesterly winds associated with the passage of cold fronts during the winter months (Black et al., 1995). Wave heights can exceed 1 m, but in most cases are less than 70 cm (Hine et al., 1986). The measurement of bottom currents off Sand Key show that the strongest bottom currents reach 28 cm/sec, and are associated with the passage of cold fronts (Harrison, 1996).
The central part of the West Florida coastline is shaped into a series of barrier islands separated by inlets. Big Sarasota Pass and New Pass are two inlets shoreward of the study area. Big Sarasota Pass has been an inlet for at least the past 3000 years (Stapor et al., 1991) while New Pass was opened during a hurricane in 1848 (Kawolski and Davis, 1995). Another inlet existed in Longboat Key at Buttonwood Harbor, but it now is closed (Davis et al., 1992). Ebb tidal deltas occupy the innermost shelf off Big Sarasota Pass and New Pass with the one off Big Sarasota Pass being substantially larger than the one off New Pass (Kawolski and Davis, 1995).
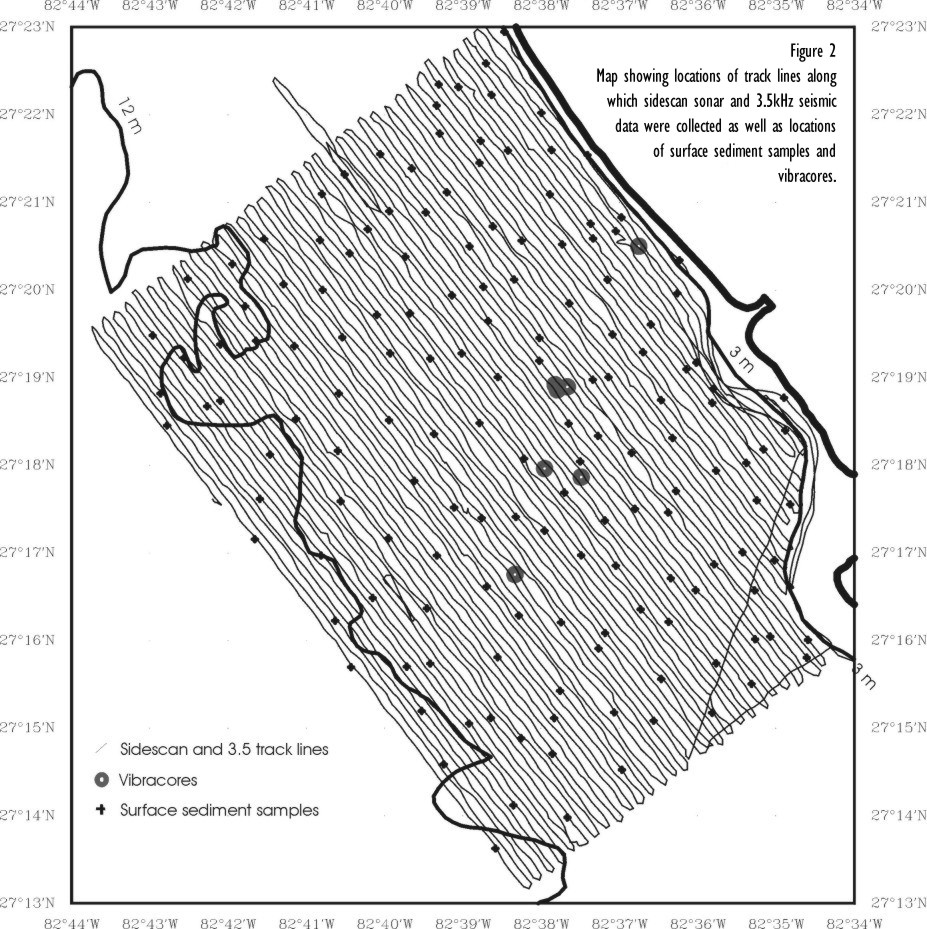 Bathymetric data, sidescan sonar images, 3.5-kHz subbottom profiles, and
surface sediment samples were collected during May 2-8, 1995 aboard the
R/V BELLOWS (operated by the University of South Florida) along tracks
spaced about 150 m apart (Fig. 2). Tracklines are not perfectly straight
due to the large number of crab pots that had been deployed in the study
area by local fishermen. Even so, tracklines rarely were more than 200
m apart, so there are very few places where the sidescan coverage is not
complete. The bathymetric data were collected using a 200-kHz echo sounder,
and the data were logged digitally. The sidescan sonar data were collected
using a 100-kHz Klein sidescan sonar system set to a 100-m range to either
side of the trackline. These data were logged digitally on a QMIPS data
logger (Danforth et al., 1991), and were written to tape at 2048 pixels
per scan. The subbottom data were collected using an Ocean Research Equipment
3.5-kHz subbottom profiler transmitting at a 0.25 second repetition rate.
These data were logged in analog form on a paper chart recorder. Ship's
navigation was by Differential Global Positioning System using the shore
station at Egmont Key, roughly 40 km to the north, at the mouth of Tampa
Bay.
Bathymetric data, sidescan sonar images, 3.5-kHz subbottom profiles, and
surface sediment samples were collected during May 2-8, 1995 aboard the
R/V BELLOWS (operated by the University of South Florida) along tracks
spaced about 150 m apart (Fig. 2). Tracklines are not perfectly straight
due to the large number of crab pots that had been deployed in the study
area by local fishermen. Even so, tracklines rarely were more than 200
m apart, so there are very few places where the sidescan coverage is not
complete. The bathymetric data were collected using a 200-kHz echo sounder,
and the data were logged digitally. The sidescan sonar data were collected
using a 100-kHz Klein sidescan sonar system set to a 100-m range to either
side of the trackline. These data were logged digitally on a QMIPS data
logger (Danforth et al., 1991), and were written to tape at 2048 pixels
per scan. The subbottom data were collected using an Ocean Research Equipment
3.5-kHz subbottom profiler transmitting at a 0.25 second repetition rate.
These data were logged in analog form on a paper chart recorder. Ship's
navigation was by Differential Global Positioning System using the shore
station at Egmont Key, roughly 40 km to the north, at the mouth of Tampa
Bay.
Surficial sediment samples were attempted
at 152 locations (Fig.
2) using an underway pipe sampler which is described by Brooks et al.
(1998). Samples were recovered at 149 of these stations.
DATA PROCESSING
 Post-cruise
processing was performed on the digital data sets, and interpretative geologic
maps were made of the analog 3.5-kHz subbottom profiles. The bathymetric
data were corrected for the 0.5 m tidal range in the study area (NOAA,
1995). The correction involved subtracting the predicted tide computed
for Sarasota, Florida from the measured depth values. The depths were corrected
to mean sea level (Fig. 3).
Post-cruise
processing was performed on the digital data sets, and interpretative geologic
maps were made of the analog 3.5-kHz subbottom profiles. The bathymetric
data were corrected for the 0.5 m tidal range in the study area (NOAA,
1995). The correction involved subtracting the predicted tide computed
for Sarasota, Florida from the measured depth values. The depths were corrected
to mean sea level (Fig. 3).
The sidescan sonar data were processed, and a digital mosaic was compiled of the entire study area. The processing steps included subsampling the raw sidescan sonar data with a median filtering routine to suppress speckle noise (Malinverno et al., 1990; Danforth et al., 1991), correcting for slant range distortion, signal attenuation, and dropped lines in the sonar data. These processing procedures are summarized by Danforth et al. (1991), and Paskevich (1992a; 1992b). After the preliminary processing, these data were used to make the composite digital mosaics. Mosaicking included mapping each strip of sonar data at the appropriate scale and projection (Paskevich, 1992c), interactively trimming off unwanted data where two sonar images overlap, tone matching the adjacent sonar images if there are differences, and combining the individual strips together into a composite image. This final step of trimming data and tone matching was done using a software package developed by PCI (Anonymous, 1992).
A complete description of the techniques used for the grain size and calcium carbonate analyses is given by Brooks et al. (1998), and is only briefly summarized here. In the laboratory, the samples were washed with deionized water to remove salt, dried, and split for textural and calcium carbonate analyses. Grain size analyses were completed using the pipette method (Folk, 1968) for the fine fraction (finer than 63 microns) and settling tube method for the fraction coarser than 63 microns (Gibbs, 1974). Percent, by weight, of calcium carbonate was determined by acid the leaching method (Milliman, 1974).
GEOLOGIC INTERPRETATION
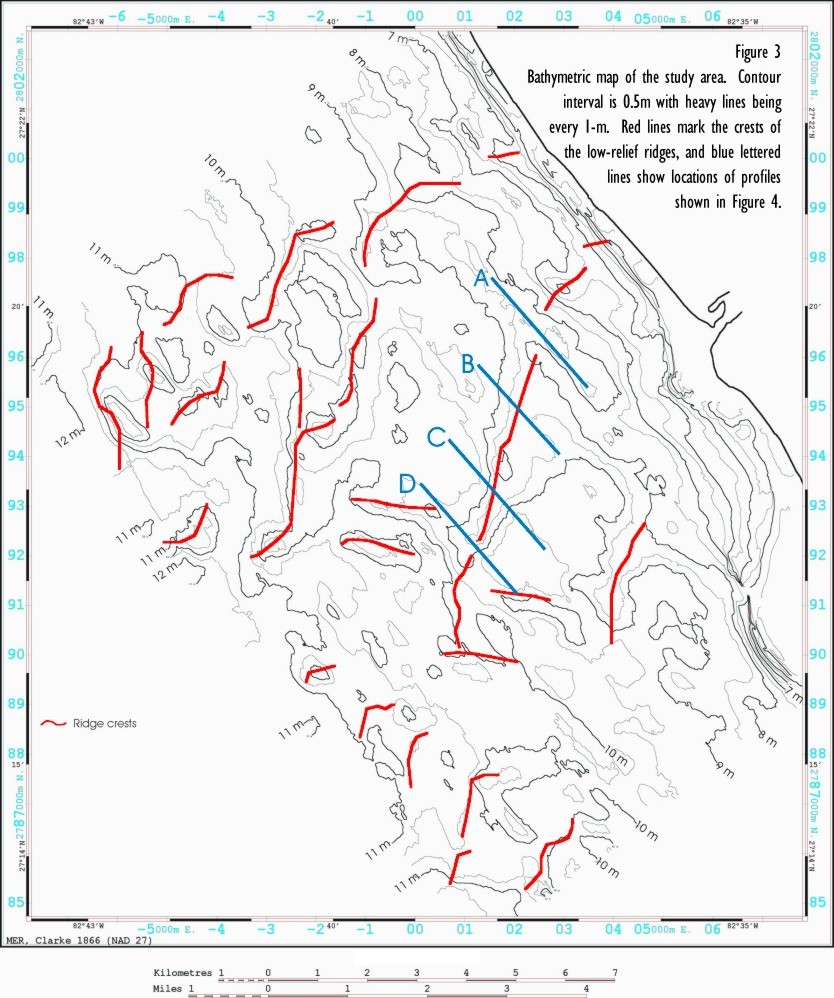
Bathymetry of the study area shows that the seafloor is shaped into two sets of ridges (National Ocean Service, 1976, and Fig. 3). Nearshore off the Longboat Key part of the study area are three short narrow ridges that trend northwest-southeast. Further offshore is a second, larger set of ridges that trend northeast-southwest. Two of these ridges extend nearly across the study area; they are 1-5 km in width, but have less than 3 m relief. These ridges have a dramatically different morphology and orientation than the narrower, taller ridges off Indian Rocks Beach (Harrison, 1996), which suggests that the origin or evolution of these two ridge systems may be different. Regional seafloor gradients are steepest in water depths shallower than 6-8 m where they range from 2-4 m/km. Here the seafloor is steepest along the seaward edge of the ebb-tidal delta off Big Sarasota Pass where gradients exceed 4 m/km.
Offshore of the
8 m isobath, the regional seafloor gradient decreases to about 0.5 m/km.
This outer part of the study area is shaped into several low-relief ridges
that trend northwest-southeast, roughly perpendicular to the trend of the
nearshore ridges. The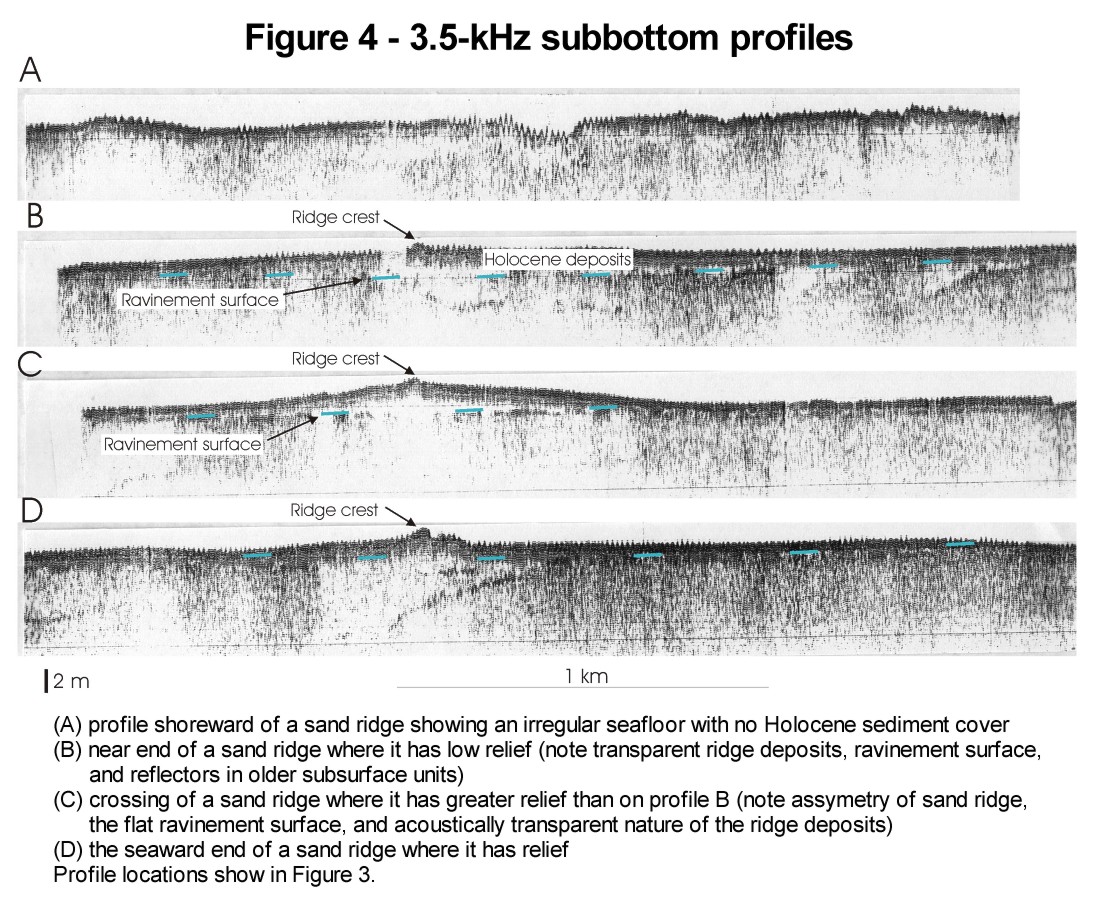 crest lines of these ridges were identified using the 3.5-kHz profiles
(Fig. 4) and sidescan sonar image because some ridge segments had too little
relief to be resolved by the contour interval used in the bathymetric map.
Between these larger ridge systems are some shorter ridges that trend perpendicular
to them, and along the seaward edge of the survey area are a series of
short ridges with sinuous crests with roughly a northeast orientation.
The bathymetric expression of the large ridges does not extend shoreward
of the 8 m contour (Fig.
3). These offshore ridges are 1-4 km wide, are 3 km to more than 10
km in length and 1-3 m high. These ridges mostly are asymmetric with their
steeper sides facing northwest. There are four major ridges that transect
the study area, however, each of these ridges can be divided into smaller,
usually arcuate, ridge sections. The bathymetry shows that the relief of
the ridges varies along their lengths with the center of each arcuate section
reaching 2-3 m relief above the floor of the adjacent troughs while the
intervening segments have less than 1-m relief. The larger ridges appear
to consist of a series of smaller ridge segments that have coalesced together
in an en-echelon form.
crest lines of these ridges were identified using the 3.5-kHz profiles
(Fig. 4) and sidescan sonar image because some ridge segments had too little
relief to be resolved by the contour interval used in the bathymetric map.
Between these larger ridge systems are some shorter ridges that trend perpendicular
to them, and along the seaward edge of the survey area are a series of
short ridges with sinuous crests with roughly a northeast orientation.
The bathymetric expression of the large ridges does not extend shoreward
of the 8 m contour (Fig.
3). These offshore ridges are 1-4 km wide, are 3 km to more than 10
km in length and 1-3 m high. These ridges mostly are asymmetric with their
steeper sides facing northwest. There are four major ridges that transect
the study area, however, each of these ridges can be divided into smaller,
usually arcuate, ridge sections. The bathymetry shows that the relief of
the ridges varies along their lengths with the center of each arcuate section
reaching 2-3 m relief above the floor of the adjacent troughs while the
intervening segments have less than 1-m relief. The larger ridges appear
to consist of a series of smaller ridge segments that have coalesced together
in an en-echelon form.
Near-surface seismic facies and stratigraphy
Two stratigraphic units have been identified on the 3.5-kHz profiles; those that accumulated before and after what is inferred to be the Holocene transgression (Fig. 4). Pre-Holocene deposits are capped by a strong, flat reflector that represents the ravinement surface cut during the Holocene marine transgression. Underlying this unconformity, the oldest unit recorded on these profiles is the Miocene aged Hawthorne Formation (Davis et al., 1989). Some of the profiles show depressions cut into this formation which presumably are filled with Neogene or Quaternary deposits (Fig. 4B).
The youngest unit
is the sediment that composes the ridges themselves. These ridges consist
of an acoustically transparent unit on the seismic profiles. Where
the ridges overly the filled depressions, a strong reflector separates
the ridge sediment
from the underlying depression fill (Fig.
4B, C, D). The strong reflector is usually smooth and at the same depth
as the seafloor in the troughs to either side of a ridge. It is interpreted
to be a marine transgressive unconformity formed during the last rise in
sealevel. At the shoreward end of some of the ridges, the unconformity
at the base of the ridge is rougher than it is further seaward Fig.
4A). The location of this rough area coincides with the increase in
seafloor gradient nearing the beach. The transparent unit reaches a maximum
thickness of 4 m under the ridge crests seaward of the 8-m isobath. It
is not limited to the ridges, however. It also occurs in thin discontinuous
patches in the troughs between the ridges, and covers much of the shelf
shoreward of the 8-m isobath (Fig. 5). This transparent unit overlies what
is interpreted to be the marine transgressive unconformity and represents
Holocene aged unconsolidated sediments.
sediment
from the underlying depression fill (Fig.
4B, C, D). The strong reflector is usually smooth and at the same depth
as the seafloor in the troughs to either side of a ridge. It is interpreted
to be a marine transgressive unconformity formed during the last rise in
sealevel. At the shoreward end of some of the ridges, the unconformity
at the base of the ridge is rougher than it is further seaward Fig.
4A). The location of this rough area coincides with the increase in
seafloor gradient nearing the beach. The transparent unit reaches a maximum
thickness of 4 m under the ridge crests seaward of the 8-m isobath. It
is not limited to the ridges, however. It also occurs in thin discontinuous
patches in the troughs between the ridges, and covers much of the shelf
shoreward of the 8-m isobath (Fig. 5). This transparent unit overlies what
is interpreted to be the marine transgressive unconformity and represents
Holocene aged unconsolidated sediments.
Sidescan sonar mosaic
 The
sidescan sonar mosaic (Fig. 6) shows a highly variable seafloor, and when
combined with the bathymetry, subbottom seismic data, and surface sediment
texture data, can be used to generate a surficial geologic map of the area.
On the sidescan sonar mosaic, high backscatter, or strong acoustic returns,
are represented by light tones; low backscatter, weak acoustic returns,
are represented by darker tones (Fig. 6). The sonar image shows a wide
variety of backscatter patterns, but these patterns fall into three primary
provinces which include a uniform low backscatter province, a uniform moderate
backscatter province, and a mottled high and low backscatter province.
The
sidescan sonar mosaic (Fig. 6) shows a highly variable seafloor, and when
combined with the bathymetry, subbottom seismic data, and surface sediment
texture data, can be used to generate a surficial geologic map of the area.
On the sidescan sonar mosaic, high backscatter, or strong acoustic returns,
are represented by light tones; low backscatter, weak acoustic returns,
are represented by darker tones (Fig. 6). The sonar image shows a wide
variety of backscatter patterns, but these patterns fall into three primary
provinces which include a uniform low backscatter province, a uniform moderate
backscatter province, and a mottled high and low backscatter province.
The low backscatter province forms a narrow band along the shoreward edge of the survey area north of New Pass; however, south of New Pass, the nearshore, low-backscatter province becomes much broader (Fig. 6). Three discontinuous low-backscatter stripes extend seaward from the nearshore province. These stripes extend nearly across the study area and are associated with the gentle southeastern sides of the northeast-southwest trending ridges. The northwestern sides of these offshore low-backscatter regions are abrupt and linear while the southeastern sides are abrupt, but more irregular in shape. Although the bathymetry shows that these ridges do not extend shoreward of 8 m, the low-backscatter signature does link the nearshore zone with some of these offshore ridges. Other low-backscatter patches occur along the seaward edge of the survey area, and most of these also are associated with subdued ridges. These offshore patches are isolated from the nearshore low backscatter province either by areas of moderate backscatter or by areas of mottled high and low backscatter (Fig. 6).
The uniform moderate to high-backscatter pattern occurs either in linear bands along the northwestern sides of many of the ridges or in irregular patches in the troughs between the ridges. In general, high-backscatter patches are larger and more abundant at the shoreward end of the troughs in shallower water depths, while moderate backscatter patches are larger and more extensive in the deeper part of the study area. In addition to occupying large parts of the floors of the troughs, this moderate to high backscatter province extends up the northeastern sides of the offshore ridges to the crests of the ridges. Along the crest of the ridges the transition from this province to the low backscatter province is extremely abrupt (Fig. 6). Most of the small bathymetric highs along the seaward edge of the study area show this same pattern of moderate to high backscatter along the northwestern sides and low backscatter along the southeastern sides.
The third acoustic province of the sidescan sonar mosaic has a mottled appearance of alternating small patches of high and low backscatter. This province mostly occurs in the troughs between the ridges and in irregular patches seaward of the ends of the large ridges. Some small mottled patches do occur within the low backscatter province, but most of these are close to shore where the low-backscatter unit is thinnest.
Surficial sediment distribution and diver observations
Grain size analyses of 149 surface sediment samples show that the surface sediment texture is highly variable. Sidescan sonar imagery and SCUBA diving observations show that the spatial variability is on a scale that is much finer than the sampling grid. For this reason, the sidescan imagery was used as a guide in drawing the boundaries between different surface sedimentary facies.
 The
surface sediments can be divided on the basis of CaCO3 content (Fig. 7)
and grain size (Fig. 8). The coarsest sediments have the highest
carbonate content and the finest sediments have the highest siliciclastic
content. Carbonate content (Fig. 7) falls into two populations; areas where
it exceeds 80% of the sediment by weight (89 of 149 samples), and areas
where it is less than 60% of the sediment by weight (51 of 149 samples).
Only 11 samples had between 60 and 80% carbonate. The areas of low carbonate
content (<60%) coincide with the areas of low backscatter on the sidescan
image (Fig.
9). Directly off the beach, increasing in width southeast of New Pass
is a belt of siliciclastic sand (CaCO3 content 3-10 %). Seaward of this
coastal siliciclastic sand belt are several NE-SW trending patches of siliciclastic
sand. Some of these offshore patches are connected to the nearshore siliciclastic
sand belt while others are not. Carbonate content in the offshore areas
range from 17-60%. Although, with the two larger patches, the CaCO3 content
progressively increases offshore, this trend is not always the case, and
some of the offshore patches show a more irregular distribution (Fig.
7). Not all the low backscatter areas were sampled, but the consistent
correlation of low backscatter and the low CaCO3 content in the areas that
were sampled strongly suggests that all the low backscatter areas have
low CaCO3 contents.
The
surface sediments can be divided on the basis of CaCO3 content (Fig. 7)
and grain size (Fig. 8). The coarsest sediments have the highest
carbonate content and the finest sediments have the highest siliciclastic
content. Carbonate content (Fig. 7) falls into two populations; areas where
it exceeds 80% of the sediment by weight (89 of 149 samples), and areas
where it is less than 60% of the sediment by weight (51 of 149 samples).
Only 11 samples had between 60 and 80% carbonate. The areas of low carbonate
content (<60%) coincide with the areas of low backscatter on the sidescan
image (Fig.
9). Directly off the beach, increasing in width southeast of New Pass
is a belt of siliciclastic sand (CaCO3 content 3-10 %). Seaward of this
coastal siliciclastic sand belt are several NE-SW trending patches of siliciclastic
sand. Some of these offshore patches are connected to the nearshore siliciclastic
sand belt while others are not. Carbonate content in the offshore areas
range from 17-60%. Although, with the two larger patches, the CaCO3 content
progressively increases offshore, this trend is not always the case, and
some of the offshore patches show a more irregular distribution (Fig.
7). Not all the low backscatter areas were sampled, but the consistent
correlation of low backscatter and the low CaCO3 content in the areas that
were sampled strongly suggests that all the low backscatter areas have
low CaCO3 contents.
The mean grain size of the samples (Fig. 8) shows that the distribution of material coarser than coarse sand corresponds closely with areas of high backscatter while areas of medium and finer sand correspond with areas of low backscatter. Gravel content in the areas of coarse sediment exceeds 10% and reaches 86%; gravel content is less than 5%, and mostly less than 1%, in the areas of fine siliciclastic sand. High gravel content coincides closely with areas of high carbonate content, and visual observations of the samples show that most of the gravel is composed of shell hash and coral fragments.
The sidescan image shows a wide variety of backscatter patterns that are distributed in a complex way in this inner shelf setting. Integration of the imagery with the bathymetry, surface sediment data, diver observations, and subsurface geology is needed to show the contributions of subsurface geology and modern processes in controlling the surficial geology of this area.
The mottled backscatter pattern on the sidescan image mostly coincides with areas where pre-Holocene strata crop out. Diver observations in these areas revealed discontinuous patches of outcrop or hardground with the intervening areas covered by a thin cover of carbonate-rich sediment. These areas of outcrop and hardground commonly had thickets of sea fans and other corals growing on them. Presumably the high-backscatter patches within these areas represent the actual extent of outcrop while lower-backscatter areas are places buried by a thin veneer of sediment.
 Some
areas of mottled sea floor occur along the crests of ridges and in other
places underlain by the Holocene and Quaternary acoustically transparent
unit, and appear to represent areas of younger hardgrounds (Fig.
9). The locations of these apparent younger hardgrounds do not show
evidence of being controlled by underlying basement topography as these
young hardgrounds are consistently underlain by the acoustically transparent
Holocene deposits (Fig.
5). The mottled high-backscatter areas along ridge crests appear to
represent modern hardgrounds that are too thin to resolve on the seismic
profiles.
Some
areas of mottled sea floor occur along the crests of ridges and in other
places underlain by the Holocene and Quaternary acoustically transparent
unit, and appear to represent areas of younger hardgrounds (Fig.
9). The locations of these apparent younger hardgrounds do not show
evidence of being controlled by underlying basement topography as these
young hardgrounds are consistently underlain by the acoustically transparent
Holocene deposits (Fig.
5). The mottled high-backscatter areas along ridge crests appear to
represent modern hardgrounds that are too thin to resolve on the seismic
profiles.
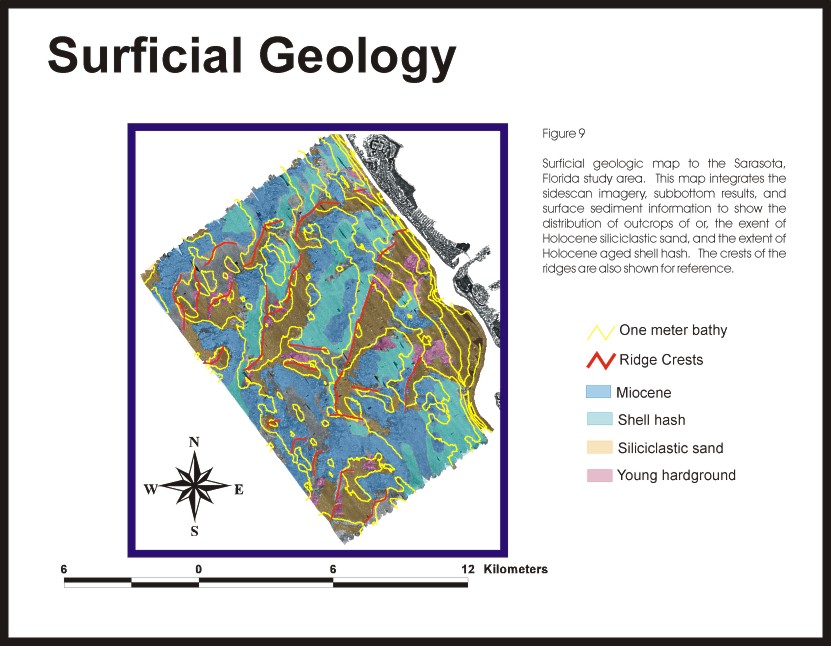
The sediment samples (Fig. 7,8) and the sidescan sonar image (Fig. 6) show that the Holocene-aged sediment as two primary facies. The first is a carbonate-rich shell hash which has a moderate to high-backscatter signature on the sonar. The high-backscatter part of this province is closer to shore while the moderate-backscatter part occupies the offshore part of the area (Fig. 6). The change in backscatter intensity coincides with an increase in gravel content and mean grain size in samples closer to shore (Fig. 8). The shell hash facies occurs mostly over the extent of the Holocene aged acoustically transparent unit (Fig. 5). Where it does cover areas of Miocene outcrop, diver observations show a sediment cover less than 10 cm thick, which is below the resolution of the 3.5-kHz seismic system. The second Holocene-aged facies is the siliciclastic sand represented by the low-backscatter unit on the sidescan mosaic (Figs. 6,9).
This detailed geologic map shows that Miocene strata have been largely covered by Quaternary and Holocene-aged sediments. The Quaternary and Holocene deposits consist of hardgrounds and unconsolidated sediments. Unconsolidated carbonate and siliciclastic sands have a systematic distribution throughout the study area that suggests that modern processes are controlling the distribution of these two sediment types. Coarse carbonate sands occur either in the troughs or on the northwestern sides of the ridges, while fine siliciclastic sands are found on the southeastern sides of the ridges. The transition from one facies to the other is extremely abrupt and consistently occurs at the crests of these low-relief ridges. Even the small ridges along the seaward edge of the study area, which are not connected to the nearshore sand, show the same distribution pattern. A coarse carbonate shell hash on the northwestern sides of the ridges appears to be a lag deposit, which perhaps is formed by currents associated with the passage of southeastward directed cold fronts. Finer siliciclastic sediments on the gentler southeastern sides of ridges appear to be sheltered from the currents by the low-relief crests of these ridges. Why this subdued relief has such a pronounced control on sediment distribution in this low-energy environment is unclear. In addition to the modern reworking of the Holocene sediments, hardgrounds are forming in localized patches on top of these young sediments.
Anonymous, 1992, Using PCI software, PCI Inc., 50 West Wilmot St, Richmond Hill, Ontario, Canada.
Black, B.D., Weisberg, R.H., and Yang, H., 1995, Seasonal variations of the West Florida shelf circulation from a process perspective, in, Gelfenbaum, G., ed., West-Central Florida Coastal Studies Workshop, US Geological Survey Open-File Report 95-840, p. 29-37.
Brooks, G.R., Doyle, L.J., DeWitt, N.T., and Suthard, B.C., 1998, Inner West-Central Florida continental shelf: Surface sediment characteristics and distribution: U.S. Geological Survey Open-File Report 98-37, 48 p.
Danforth, W.W., O'Brien, T.F., and Schwab, W.C., 1991, USGS image processing system: near real-time mosaicking of high-resolution side scan SONAR data: Sea Technology, v. 32, p. 54-50.
Davis, R.A., Knowles, S.C., and Bland, M.J., 1989, Role of hurricanes in the Holocene stratigraphy of estuaries: Examples from the Gulf coast of Florida: Journal of Sedimentary Petrology, v. 59, p. 1052-1061.
Davis, R.A. and Hine, A.C., 1989, Quaternary geology and sedimentology of the Barrier Island and Marshy Coast, West-Central Florida, USA: Field Trip Guidebook T375 of the 28th International Geological Congress, American Geophysical Union.
Davis, R.A. and Klay, J.M., 1989, Origin and development of Quaternary terrigenous inner shelf sequences, southwest Florida: Transactions of the Gulf Coast Association of Geological Societies, v. 39, p. 341-347.
Davis, R.A., Hine, A.C., and Shinn, E.A., 1992, Holocene coastal development on the Florida Peninsula: in Fletcher, C. H. and Wehmiller, J. E., eds., Quaternary Coasts of the United States: Marine and Lacustrine Systems, SEPM Special Publication No. 48, p. 193-212.
Doyle, L.J. and Sparks, T.N., 1980, Sediment of the Mississippi, Alabama, and Florida (MAFLA) continental shelf: Journal of Sedimentary Petrology, v. 50, p. 905-916.
Folk, R.L., 1968, Petrology of sedimentary rocks: Hempills Bookstore, Austin, TX, 170 p.
Gibbs, R.J., 1974, A settling tube for sand-size analysis: Journal of Sedimentary Petrology, v. 44, p. 583-588.
Gould, H.R. and Stewart, R.H., 1956, Continental terrace sediments in the northeastern Gulf of Mexico: SEPM Special Publication No. 3, p. 2-19.
Harrison, S.E., 1996, Morphology and evolution of a Holocene carbonate/siliciclastic sand ridge field, West-Central Florida inner shelf: MS Thesis, Univ. of South Florida, St. Petersburg, FL, 211 p.
Hine, A. C., Davis, R. A., Mearns, D. L., and Bland, M., 1986, Impact of Floridas Gulf coast inlets on the coastal sand budget: Final Report to Division of Beaches and Shores, Florida Department of Natural Resources, 128 p.
Hine, A.C., 1996, Structural, stratigraphic, and paleoceanographic development of the margins of the Florida Platform, in, Randazzo, A.F. and Jones, D.S., eds., Geology of Florida, p. .
Kowalski, K.A. and Davis, R.A., 1995, Stratigraphy of Big Sarasota Pass and New Pass ebb-tidal deltas, Sarasota County, Florida, in, Gelfenbaum, G., ed., West-Central Florida Coastal Studies Workshop, US Geological Survey Open-File Report 95-840, p. 109-112.
Malinverno, A, Edwards, M.H., and Ryan, W.B.F., 1990, Processing of SeaMARC swath sonar data: IEEE Journal of Oceanic Engineering, v. 15, p. 14-23.
Milliman, J.D., 1974, Marine carbonates: Springer-Verlag, New York, 375 p.
National Oceanic and Atmospheric Administration, 1995, Tide tables 1995: East coast of North and South America. U.S. Department of Commerce, _ pp.
National Ocean Survey, 1976, St. Petersburg: Bathymetric map NG 17-1, scale 1:250,000.
Paskevich, Valerie, 1992a, Woods Hole image processing system software implementation: using NetCDF as a software interface for image processing: US Geological Survey Open-File Report 92-25, 66 p.
Paskevich, Valerie, 1992b, Digital processing of side-scan sonar data with the Woods Hole Image Processing System software: US Geological Survey Open-File Report 92-204, 9 p.
Paskevich, Valerie, 1992c, Digital mapping of side-scan sonar data with the Woods Hole Image Processing System software: US Geological Survey Open-File Report 92-536, 87p.
Stapor, F.W., Mathews, T.D., and Lindforns-Kearns, F.E., 1991, Barrier island progradation and Holocene sea-level history in southwest Florida: Journal of Coastal Research, v. 7, p. 815-838.
Tanner, W.F., 1960, Florida coastal classification: Transactions of the Gulf Coast Association of Geological Societies, v. 10, p. 259-266.
FIGURE 1: Index map showing the location of the sidescan sonar survey off Sarasota, Florida.
FIGURE 2: Map showing locations of track lines along which sidescan sonar and 3.5-kHz seismic data were collected as well as locations of surface sediment samples and vibracores.
FIGURE 3: Bathymetric map of the study area. Contour interval is 0.5 m with the heavy lines being every 1-m. Red lines mark the crests of the low-relief ridges, and blue lettered lines show locations of profiles shown in Figure 4.
FIGURE 4: 3.5-kHz subbottom profiles: (A) profile shoreward of a sand ridge showing an irregular seafloor with no Holocene sediment cover, (B) nearshore end of a sand ridge where it has low relief (note transparent ridge deposits, ravinement surface, and reflectors in older subsurface units), (C) crossing of a sand ridge where it has greater relief than on profile B (note asymmetry of sand ridge, the flat ravinement surface, and the acoustically transparent nature of the ridge deposits), and (D) the seaward end of the sand ridge where it has less relief. Profile locations shown in Figure 3.
FIGURE 5: Isopach map showing the thickness of Holocene deposits overlying the ravinement surface.
FIGURE 6: Sidescan sonar image of the study area with the 1-m bathymetric contours shown in blue and the ridge crests in red. Low-backscatter on the sidescan image is represented by the dark tones and high-backscatter by the light tones. The aerial photographs of the land component of the image were scanned, orthophoto rectified, and merged with the sidescan imagery using the PCI software.
FIGURE 7: Map showing the percent CaCO3 in the surface sediment samples. The sidescan image was used to draw the contact between sediments with high and low carbonate contents because they are acoustically dramatically different. Sediments with high carbonate content tend to have a high-backscatter signature on the sonar image while sediments with low carbonate content have a low-backscatter signature.
FIGURE 8: Map showing the mean-grain size of the surface sediments based on 149 underway sediment samples and the sidescan sonar image.
FIGURE 9: Surficial geologic map of the study area offshore of Sarasota, Florida. This map integrates the sidescan imagery, subbottom results, and surface sediment information to show calcareous rocks of Miocene age, the extent of Holocene siliciclastic sand, the extent of Holocene aged shell hash, and the crests of the ridges are also shown for reference. [an error occurred while processing this directive]