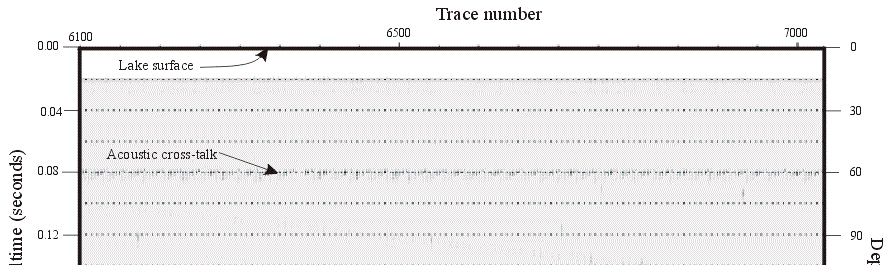
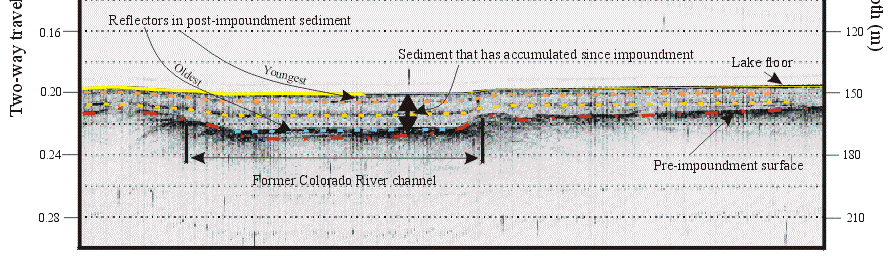
Figure 6. Enlarged section of a seismic profile showing the different features identified on the profiles. The numbers across the top of the profile represent the shot or trace number (shots here are 1.0 seconds apart). The depth on the left side of the profile is in seconds, and on the right depth has been converted to meters assuming a constant speed of sound of 1500 m/sec. The lake surface is at the top of the profile. Acoustic cross-talk, or interference, between the sidescan sonar and subbottom profiler shows in the water column. The lake floor is the first reflector (yellow), and the reflector representing the pre-impoundment surface is the deepest reflector (red). Four reflectors within the sediment that has accumulated since impoundment show as flat-lying horizons that pinch out against the pre-impoundment surface.
|
|