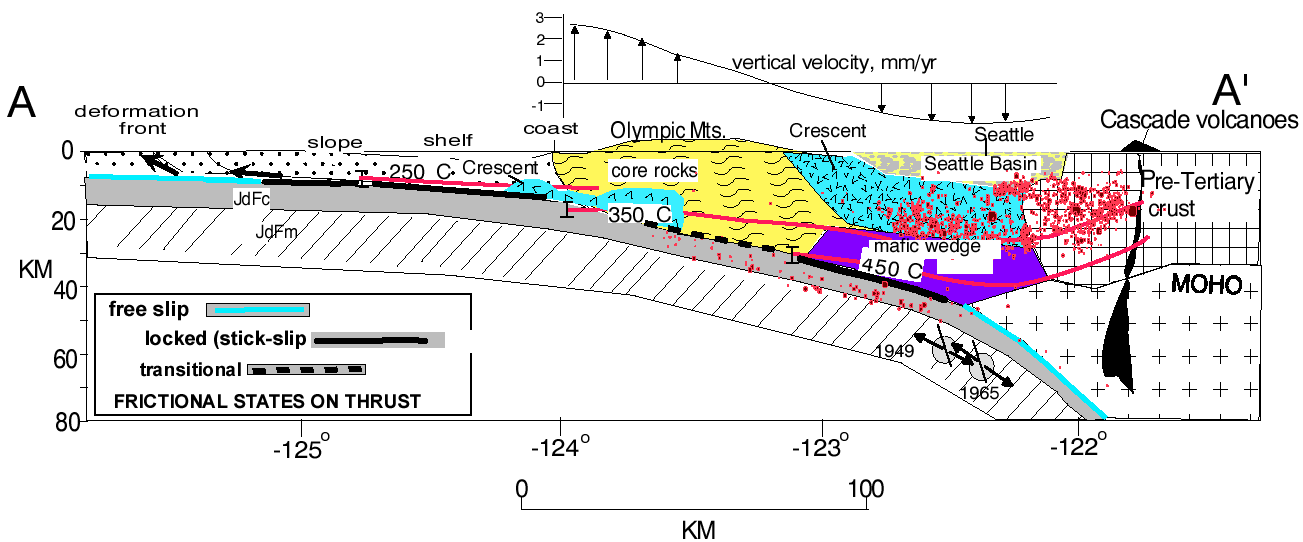

Figure 44 (a)--Geologic interpretation of east-west velocity model through the Seattle region, coresponding to
profile AA' of Figure 4a and based on row 23 and nearby velocity sections. JdFc=Juan de Fuca crust; JdFm=Juan de
Fuca mantle. Estimated error bars for isotherms are indicated near intersection of isotherms and JDFP. Red dots
are earthquakes. Frictional states along the subduction thrust are indicated by line patterns in the legend (lower
left in figure). Bold arrows denote upflow of fluids along the subduction thrust. Offshore geology constructed
from seismic reflection and refraction results of Flueh et al. (1998).
![]()
