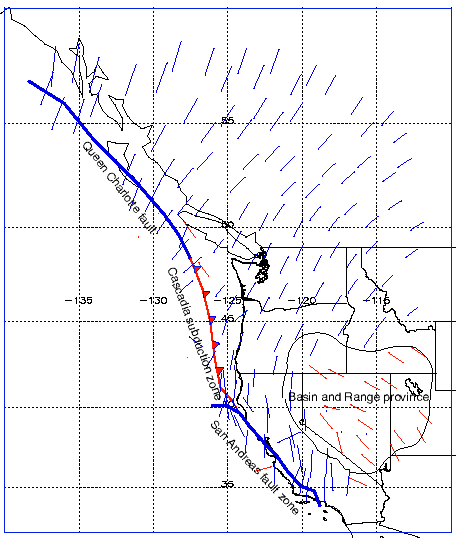
Figure 60
---Finite-element stress model of western U. S. using the 'PLATES' program. Blue lines are indicators of maximum horizontal stress as compressive stress and red lines are where maximum horizontal stress is extension.