
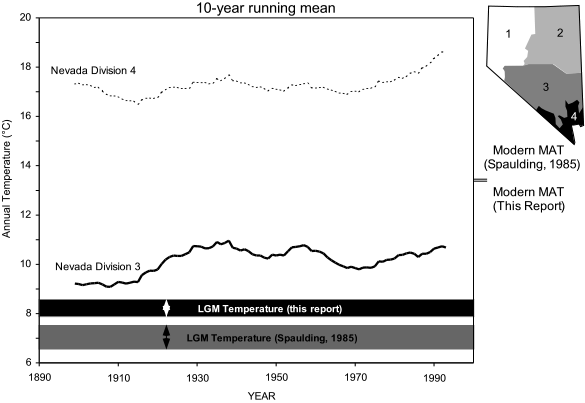
Figure 13. Historic variations in annual temperature depicted as 10-year running means. Data are from NOAA compilations of instrumental weather data for Nevada regions 3 and 4 (see inset map). The modern mean annual temperature estimates for Yucca Mountain (5000 ft, 1524 m elevation) from Spaulding (1985) and this report are shown on the right. The mean annual temperature reconstructions for the Last Glacial Maximum (LGM) from Spaulding (1985) and this report are shown as gray bands on the lower part of the figure.
| AccessibilityFOIAPrivacyPolicies and Notices | |
| |
|