
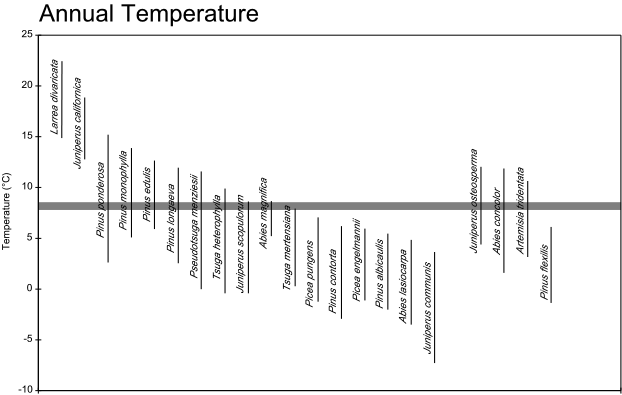
Figure 9. Present-day correspondences between mean annual temperature and the distribution of selected tree and shrub species from western North America (see caption for Figure 7 for a more complete explanation).
| AccessibilityFOIAPrivacyPolicies and Notices | |
| |
|