

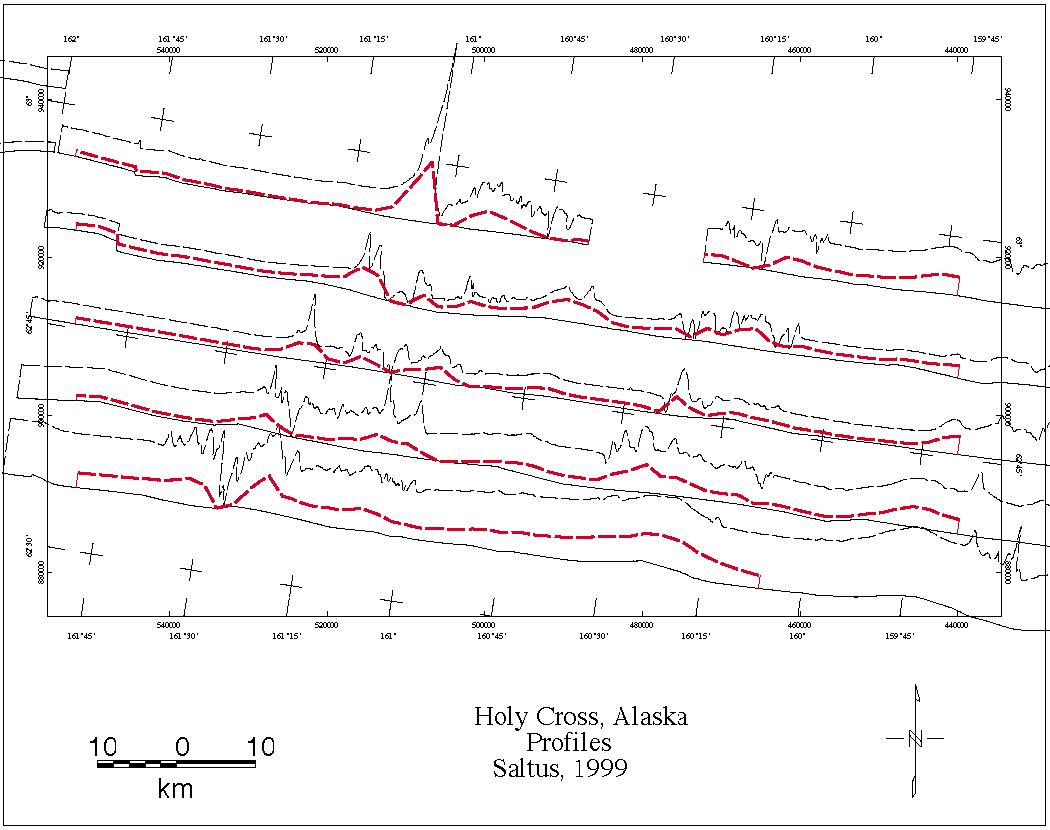
We have spent some time looking at the magnetic features in the gridded compilation. The aeromagnetic flightline data contain a wealth of information that cannot typically be captured in a grid. Here is an extreme example, 6 mile spaced aeromagnetic profiles collected as part of the National Uranium Resource Evaluation (NURE) in central Alaska. The colored grid lacks the detail evident in the black profiles. The red profiles (easier to see on the next image) show the level of detail present in the grid along the profiles. A goal of the Alaska mag project is to make this profile information readily accessible for geologic interpretation, both inside and outside the USGS. We are nearing completion of a flightline database for the 85 core surveys of Alaska. This database contains data channels that are leveled to the digital grids.
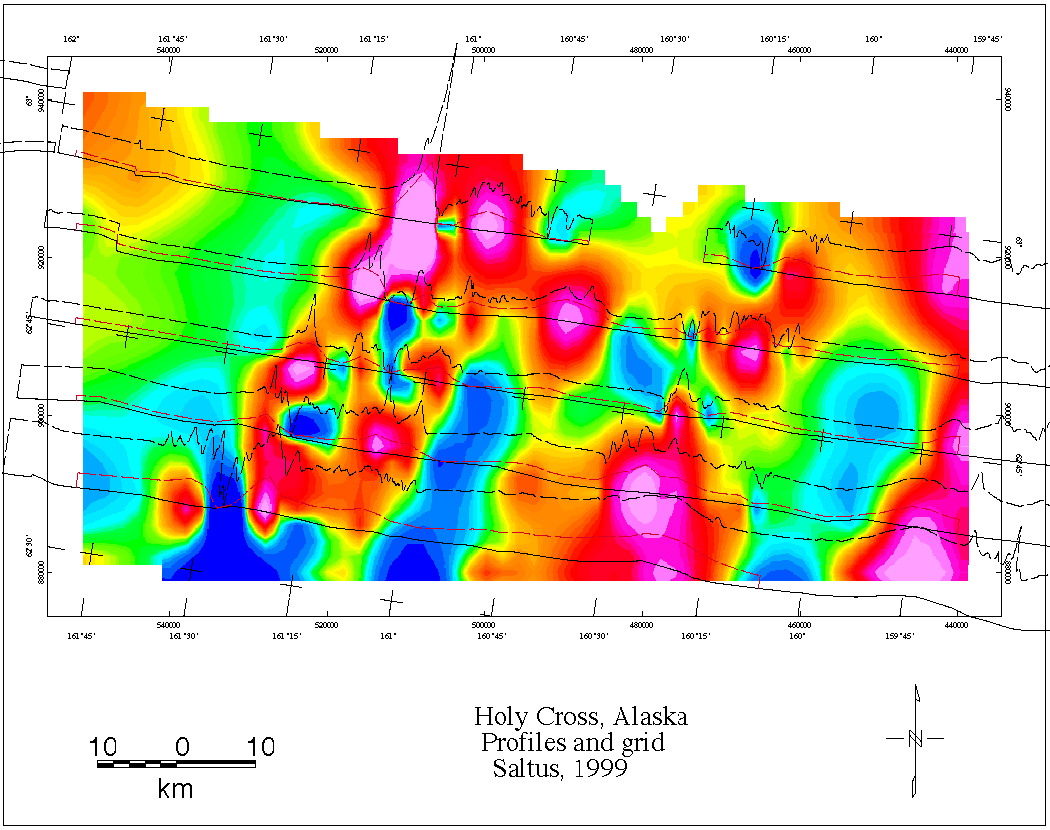
This is the same view with the grid suppressed. The difference between the red and black lines demonstrates the resolution lost in gridding.
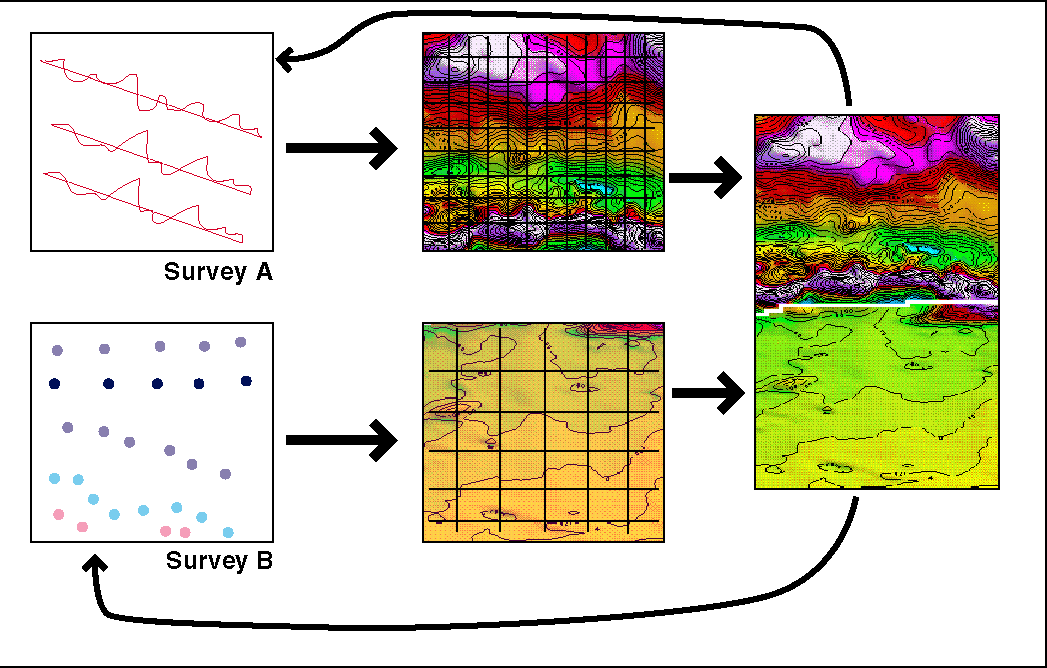
This simple graphic indicates the flow of data in the Alaska magnetic
project. Raw data, either in profile or discrete digitized
form is edited and then gridded. The grids are then processed,
upward/downward continued, etc., and merged together into a composite
grid. The construction of a flightline database completes the circuit
by adding leveled channels back to the archive database. This
helps to make the detailed information contained in the original data
available for interpretation.
Ideally, the arrows in this flow chart would
be live links. In the future it would be beneficial to construct a linked system where addition of
new or improved data, discovery of better data processing and manipulation
procedures, etc., can be used to update our view of Alaska. A gridded
view is really a base-level interpretation map. Therefore, expanding this
live data linkage to include links to interpretive maps such as
estimated depths to basement, lineaments, etc. as well as links with
other regional data sets would improve interpretation abilities.
Thus far, our focus has
been toward one-way paths to data processing and interpretation;
another improvement would be
to build links back to the original data as well as construct
live, changeable and reproducible links between our data and
interpretations.
Like Shelby, we are on the move and can envision more efficient
forms of transportation in the future. The present Alaska geophysical
data project is building on an aeromagnetic data history of more than
50 years; we are working to rescue, document, and release more than
1 million line-kilometers of data. One goal of the project is
to make the information in these data accessible to a wide variety of
possible users - we are seeking to clarify geophysical terminology
and help non-traditional users access and understand the
constraints that these data can offer to a variety of geologic and
geotechnical issues at a variety of scales. A key to maintaining and
updating these data will be to use new software developments to
link basic data to interpretations so that new data, auxiliary information,
and outside constraints can be readily incorporated in updated
understanding.
Saltus, R.W., Hill, P.L., Connard, G.G., Hudson, T.L., and Barnett, A., 1999,
Building a Magnetic View of Alaska:
U.S. Geological Survey Open-File Report 99-0418.