Open-File Report 00-321
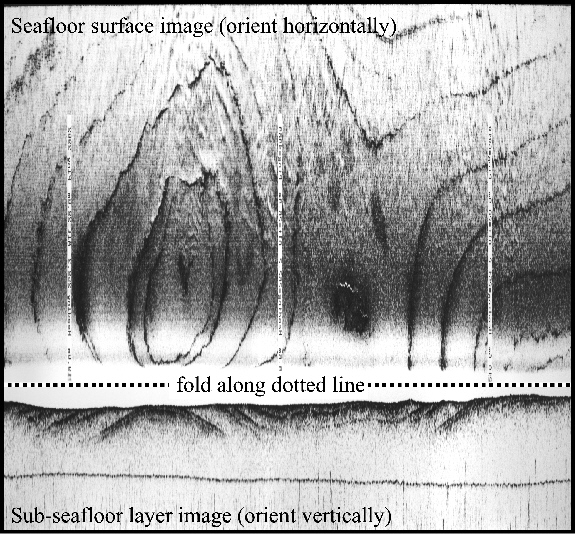
Figure 3. Section of sidescan and subbottom profiler data from 1998 Channel Islands survey north of Anacapa Island. If you print out this page and fold it 90 degrees along the dotted line you can see a 3D model of the geology in this area. The sidescan image of the surface shows circular rock outcrops (dark gray areas), surrounded by sandy areas (medium grey). The subbottom profile shows that the circular pattern of rock outcrop is the result of folding of layered sedimentary rocks, and subsequent erosion of the tops of the folds by waves during a period of low sea level. The rock exposed at the seafloor must be layers more resistant to erosion. The intervening layers appear to be covered by sand, however because we can not see horizontal surface layers in the subbottom profile data we know that the sand deposits between the rock outcrops are less than 15 cm thick.

![]() U.S. Department of the Interior |
U.S. Geological Survey
U.S. Department of the Interior |
U.S. Geological Survey
URL:
Page Contact Information:
Page Last Modified:
