U.S. Geological Survey Open-File Report 00–494
This report is preliminary and has not been reviewed for conformity with U.S. Geological Survey editorial standards or with the North American Stratigraphic Code. Any use of trade, product, or firm names is for descriptive purposes only and does not imply endorsement by the U.S. Government
Contents:
Introduction
Survey Descriptions
Instrumentation
Data Processing
Areal Coverage
SEG-Y and Image data
Positional and metadata
Data Display
Contacts
References
Between 1993 and 1997, the U.S. Geological Survey acquired high-resolution, marine seismic-reflection profile data across submerged portions of known and inferred upper crustal fault zones throughout the greater San Francisco Bay area. Surveys were conducted oversouth San Francisco Bay in the vicinity of the San Bruno shoal (roughly between the San Francisco and Oakland airports), over the offshore extension of the San Andreas fault system west of the Golden Gate, over the Hayward fault to Rodgers Creek fault step-over in San Pablo Bay, and over the Kirby Hills fault where it crosses the western Sacramento Delta. Reconnaissance profiles were acquired elsewhere throughout the San Francisco and San Pablo Bays.
These data were acquired by the U.S. Geological Survey, Western Coastal and Marine Geology Team, under the auspices of the Central California/San Francisco Bay Earthquake Hazards Project.
Analysis and interpretation of some of these profiles has been published by Marlow and others (1996, 1999). Further analysis and interpretation of these data are available in a USGS. Professional Paper Crustal Structure of the Coastal and Marine San Francisco Bay Region, T. Parsons, editor, http://geopubs.wr.usgs.gov/prof-paper/pp1658/ [link added 2012 mfd].
The surveys were conducted from two vessels: the David Johnston, a 40-foot research vessel; and the Robert Gray, a 120-foot tug converted to research use. The surveys are summarized in the following table:
|
Date
|
Cruise ID
|
Vessel
|
CMP interval (m)
|
Source
|
|
July, 1993
|
J8-93-SF
|
David Johnston
|
3.12
|
2x40 cu.in. Bolt (2000 psi)
|
|
May, 1994
|
J2-94-SF
|
David Johnston
|
3.12
|
2x40 cu.in. Bolt (2000 psi)
|
|
June, 1995
|
G2-95-SF
|
Robert Gray
|
3.12
|
2x40 cu.in. Bolt (2000 psi)
|
|
March, 1997
|
J4-97-SF
|
David Johnston
|
5.00
|
2x35 cu.in. GI (3000 psi)
|
The acquisition system consisted of a small air gun source received by a 24-channel hydrophone streamer and digital data recording system. The streamer, manufactured by Innovative Transducers, Inc. (ITI) was of solid-core construction with "thin-film" cylindrical hydrophones of polyvinylidene fluoride (PVDF) plastic, which are characterized by high sensitivity and broad band (5-5000 Hz) frequency response. In 1993 through 1995, the streamer used was 150 active meters, with a 6.25-meter group interval (one hydrophone per group). In 1997, a 240-meter long streamer with a 10-meter group interval (three hydrophones per group) was used. The data were recorded with the Geometrics Strataview recorder, a compact, PC-based instrument with approximately 24-bit (120 dB measured) dynamic range. Field sampling interval was 1 millisecond and field record length was 2 seconds.
In 1993 through 1995, the air-gun source consisted of one or two Bolt 600-series air guns with 40 cubic-inch chambers and waveshape kits, fired at either 6.25-meter or 12.5-meter intervals. Factors limiting the firing interval were air compressor capacity and the time required by the recording system to process each shot. At speeds below 3.5 knots, the 6.25-meter fire interval could be maintained; higher speeds (generally tide-controlled) necessitated the longer fire interval. Resulting common-mid-point (CMP) data were either 12-fold or 6-fold, with a 3.125-meter CMP interval.
In 1997, a dual-chamber GI ("Generator-Injector") air gun was used. The "injector" chamber of the GI gun is timed to discharge a short time (typically 20-30 msec) after the "generator" chamber so as to suppress the bubble pulse and create an optimal signal. This gun was fired as fast as the air compressor would allow, typically 10 to 12 seconds. Stack fold therefore varied depending on the speed of the survey vessel, between a maximum of 12 and a minimum of 4.
In 1993 and 1994, navigation was based on a single Global Positioning System (GPS) receiver; absolute position accuracy was approximately ± 30 m. However, relative positions from fix to fix, are accurate to within a few meters. In 1995 and 1997, positioning was accomplished with differential GPS, resulting in absolute positional accuracy of approximately ± 10 meters.
In 1994, very-high resolution reflection profiles were acquired concurrently with the air gun data. The "Seistec" instrument used to acquire these profiles was manufactured by IKB Technologies Limited of Bedford, Nova Scotia, Canada, and consisted of a source and receiver mounted together in a 6-foot catamaran sled towed behind and to the side of the survey vessel. The source consisted of a wide band electro-mechanical "boomer" which generated a single positive pressure transient; the receiver was an in-line-cone hydrophone array oriented to maximize vertical-incidence reflection energy. Data were recorded digitally at 16 kHz sampling for 200 msec. Low power levels from the analog signal conditioner resulted in recorded datasets with relatively low dynamic range (less than 30 dB). However, vertical resolution of better than 50 cm to a subbottom depth of approximately 25 meters and lateral resolution on the order of 1 meter were achieved.
The characteristics of the air gun and Seistec sources are shown in the table below:
|
System
|
Power
|
Frequency range
|
Repetition rate
|
Towing depth
|
Pulse |
|
Bolt 600
air gun |
one or two 40 cu.in. units at 2000 psi; 1.6 to 2.0
bar-m Pk-Pk; 225 dB*
|
20-500 Hz
|
8 to 12 sec
|
1 to 2 meters
|
10 msec typical
|
|
GI air gun
|
35 cu.in. Generator and Injector at 3000 psi; 2.0
bar-m Pk-Pk; 226 dB*
|
20-500 Hz
|
8 to 12 sec
|
1 to 2 meters
|
10 msec typical
|
|
Seistec (boomer)
|
217 dB Pk-Pk*
|
250-7000 Hz
|
0.25 to 0.5 sec
|
surface
|
0.35 msec typical
|
*- dB referenced to 1 micropascal at 1 m.
Air gun data were originally recorded in SEG-2 format and converted to SEG-Y formatted files in the field. Data were processed with a FOCUS/DISCO (Paradigm Geophysical, Inc.) processing system. A representative processing sequence is shown below:
1. SEGY input and resample to 2 msec
2. Trace edit
3. Geometry assignment
4. Bandpass filter: 50-200 Hz
5. Automatic gain control: 100 msec window
6. Water-bottom mute
7. FK-filter: 50-200hz; ±
2400 m/s
8. Spiking deconvolution
9. Common midpoint (CMP) sort
10. Stacking velocity analysis
11. Normal move-out correction
12. Stack
13. SEG-Y output
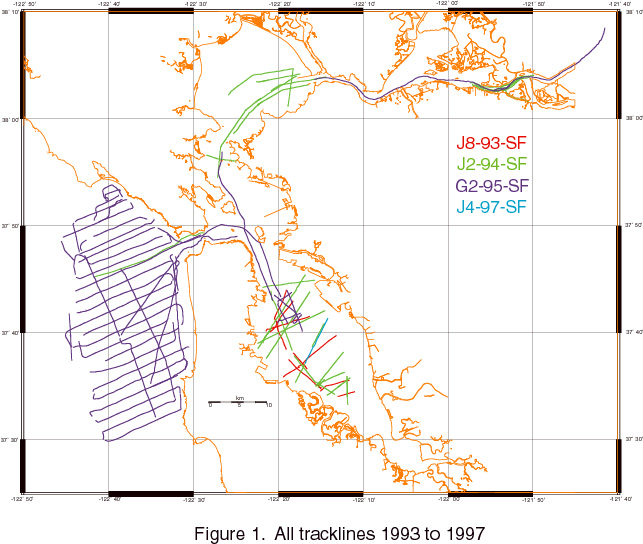
Tracklines for all four survey years are shown in Figure 1. Figure 2, Figure 3, and Figure 4 show line coverage for the central San Francisco Bay, the Golden Gate, and the northern San Francisco and San Pablo Bay areas in greater detail. Very-high resolution coverage (Seistec) lines from 1994 are shown in Figure 5. Thumbnail images of the seismic lines shown in each figure can be viewed by selecting a hot link under each line label. Thumbnail images are displayed with either north or west at the left side of the image. The lateral scale of the image and therefore the vertical exaggeration of the images are indeterminate.
The seismic reflection profiles and associated data are provided with this report. The profile data are written as files in SEG-Y exchange format (Barry and others, 1975).
Stacked multichannel air gun profiles: the stacked SEG-Y data are written in 32-bit IBM floating point format at a 2 ms sample rate; record length is 1 or 2 seconds. The EBCDIC header for each file contains additional descriptive information.
Very-high resolution single-channel (Seistec) data: the SEG-Y data are written in 16-bit integer format at a 62.5 microsecond sample rate (16 kHz) and a 100 msec record length. The EBCDIC header for each file contains additional descriptive information. Because these Seistec files were characterized by low dynamic range, they could be highly compressed (> 80%) with the Unix gzip utility.
Digital data and profile images are organized by the areas shown in Figures 2 through 5:
Central San Francisco Bay (Figure 2)
In addition to the SEG-Y digital data file, each profile is provided in both a high-quality image (PostScript), and a low-quality image (gif). These images were created with Seismic Unix (see Data Display below), with no further processing applied. The Postscript image files have been compressed with the Unix gzip utility to facilitate download.
Flat ASCII files of CDP and shotpoint locations, in both UTM coordinates and latitude/longitude are available for all air gun profiles. Each file is prefaced with explanatory information on the data types and format of the file. For the 1994 Seistec data, the positional data are simply latitude/longitude as a function of Greenwich Mean Time (GMT). A table of start and end times for each line can be used to accurately position these profiles from the navigational fixes if desired.
A metadata file conforming to the Federal Geographic Data Committee (FGDC) Content Standard for Digital Geospatial Metadata (June 8, 1994) is provided for each cruise (for further information, see: http://www.fgdc.gov/metadata/ ). A SEG-Y file header for each cruise is also provided.
No software is provided for preview or display of the SEG-Y, image or navigational data. SEG-Y data can be displayed, printed or further processed using a variety of seismic processing programs that run on UNIX, Windows and Macintosh systems. A public-domain seismic processing package, SU, is available via the Internet at: http://www.cwp.mines.edu/cwpcodes/ .
Postscript and gif images of the seismic lines can be opened in any of numerous graphics packages. The image files are not at any particular scale or vertical exaggeration. It is the responsibility of the user to establish lateral scale based on the positional data.
Navigation files can be plotted using commercial GIS software such as ARC/INFO. The Generic Mapping Tools (GMT), a public-domain mapping package for visualizing geographic vector data on Unix systems, was used to create the trackline figures, and is available via the Internet at: http://imina.soest.hawaii.edu/gmt/
For further information regarding these datasets contact:
Jon Childs Pat Hart U.S. Geological Survey U.S. Geological Survey M/S 999 M/S 999 345 Middlefield Rd. 345 Middlefield Rd. Menlo Park CA 94025 Menlo Park CA 94025 (650) 329-5195 (650) 329-5160 jchilds@usgs.gov hart@usgs.gov Barry, K.M., Cavers, D.A., and Kneale, C.W., 1975, Recommended standards for digital tape formats: Geophysics, v. 40, p. 344-352
Bruns, T.R., Cooper, A.K., Carlson, P.R., and McCulloch, D.S., 2001, Structure of the submerged San Andreas and San Gregorio fault zones in the Gulf of the Farallones off San Francisco, California from high-resolution seismic reflection data, in press http://geopubs.wr.usgs.gov/prof-paper/pp1658/ see Chapter 7 [link added 2012 mfd].
Marlow, M.S., Hart, P.E., Carlson, P.R., Childs, J.R., Mann, D.M., Anima, R.J., and Kayen, R.E., 1996, Misinterpretation of lateral acoustic variations on high-resolution seismic reflection profiles as fault offsets of Holocene bay mud beneath the southern part of San Francisco Bay, California, Marine and Petroleum Geology, v. 13, no. 3, pp. 341-348
Marlow, M.S., R.C. Jachens, P.E. Hart, P.R. Carlson, R.J. Anima, and J.R. Childs, 1999, Development of San Leandro synform and neotectonics of the San Francisco Bay block, California: Marine and Petroleum Geology, v. 16, p. 433-442Parsons, T., ed., Crustal Structure of the Coastal and Marine San Francisco Bay Area Region, 2001, U.S. Geological Survey Professional Paper, in press http://geopubs.wr.usgs.gov/prof-paper/pp1658/ [link added 2012 mfd].
Suggested citation:
Childs, J.R., Hart, P., Bruns, T.R., Marlow, M.S., and Sliter, R., 2000, High-resolution marine seismic reflection data from the San Francisco Bay Area: U.S. Geological Survey Open-File Report 00–494. (Available at https://pubs.usgs.gov/of/2000/0494/.)
- This report is available only on the Web.
For additional information:
Contact Information, Pacific Coastal and Marine Science Center
U.S. Geological Survey
345 Middlefield Road, MS-999
Menlo Park, CA 94025-3591
http://walrus.wr.usgs.gov/

U.S. Department of the Interior | U.S. Geological Survey
URL: http://pubsdata.usgs.gov/pubs/of/2000/0494/index.htm
Page Contact Information: GS Pubs Web Contact
Page Last Modified: Wednesday, 07-Dec-2016 18:16:12 EST
