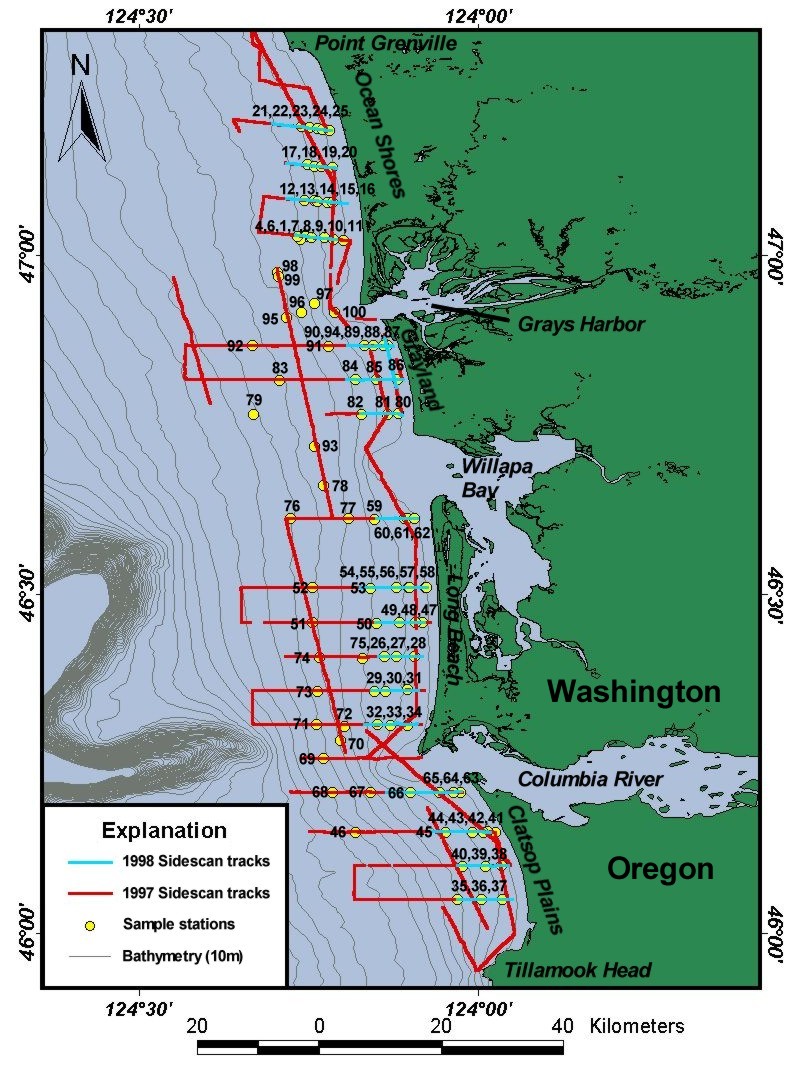
 Figure 1. Map of the study area showing locations of track
lines along which sidescan-sonar data were collected, and sampling stations. Click
on the figure to view a larger scale image.
Figure 1. Map of the study area showing locations of track
lines along which sidescan-sonar data were collected, and sampling stations. Click
on the figure to view a larger scale image.Figure 1. Map of the study area showing locations of track
lines along which sidescan-sonar data were collected, and sampling stations. Click
on the figure to view a larger scale image.
[an error occurred while processing this directive]