|
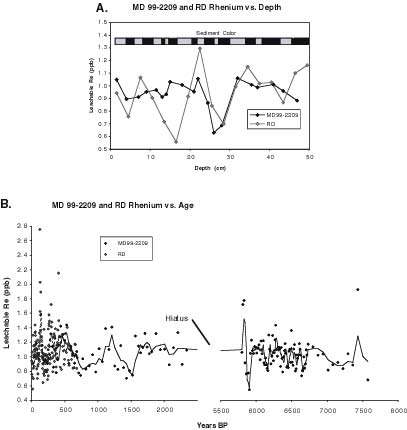
Figure 10.2. A. Plots showing data for leachable Re vs. depth for cores RD-98 and MD99-2209. Color banding of sediments is indicated by the corresponding gray and black intervals shown. B. Combined Re data for all of core RD-98 and the portion of core MD99-2209 below 300 cm vs. age. Dashed line is a 10-point moving average of RD-98 data and solid line is a 3-point moving average of MD99-2209 data. The hiatus shown represents about 3500 years between 2300 and 5800 yr before present (BP) based on calibrated carbonate radiocarbon data bracketing the horizon. |
TO RETURN TO REPORT, CLOSE THIS WINDOW.
U.S. Department of Interior, U.S. Geological Survey
URL of this page: https://pubs.usgs.gov/openfile/of00-306/chapter10/fig10-2.html
Maintained by: Eastern Publications Group Web Team
Last modified: 03.30.01 (krw)