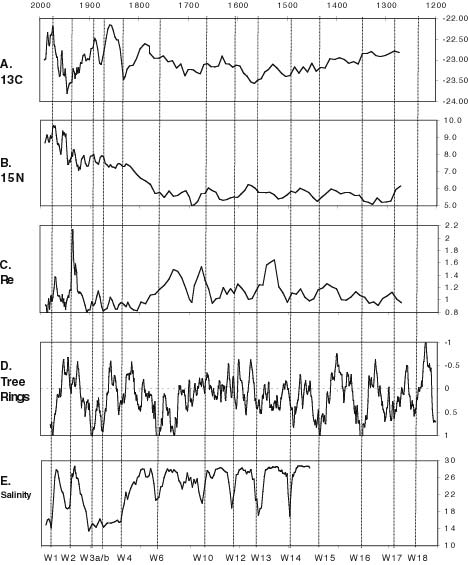
Figure 10.3. Correlated plots of 3-point moving averages from core RD-98 data (A, B, and C) vs. age; Palmer Hydrologic Drought Index (PHDI) data from Stahle and others (1998) and Cronin and others (2000) (D); and paleo-salinity data from Cronin and others (2000) (E). A. Data for  13Corg (% PDB) from acidified bulk sediment. B. Data for 15N (parts per mil air) from acidified bulk sediment. C. Leachable Re (ppb). D. PHDI from cypress tree-ring composites from North Carolina and Virginia; line plotted is a 15-point moving average. E. Paleo-salinity in ppt (parts per mil) calculated from benthic foraminiferal abundance ratios calibrated to modern environmental tolerance data and historical rainfall and streamflow data. Correlation lines (dotted) are labeled with wet period designations used in Cronin and others (2000), Figure 3, for W1-W14; W15-W-18 are extrapolated based on PHDI data. Lines for W5, W7-9, and W11 are not shown. 13Corg (% PDB) from acidified bulk sediment. B. Data for 15N (parts per mil air) from acidified bulk sediment. C. Leachable Re (ppb). D. PHDI from cypress tree-ring composites from North Carolina and Virginia; line plotted is a 15-point moving average. E. Paleo-salinity in ppt (parts per mil) calculated from benthic foraminiferal abundance ratios calibrated to modern environmental tolerance data and historical rainfall and streamflow data. Correlation lines (dotted) are labeled with wet period designations used in Cronin and others (2000), Figure 3, for W1-W14; W15-W-18 are extrapolated based on PHDI data. Lines for W5, W7-9, and W11 are not shown.
|
TO RETURN TO REPORT, CLOSE THIS WINDOW.
U.S. Department of Interior, U.S. Geological Survey
URL of this page: https://pubs.usgs.gov/openfile/of00-306/chapter10/fig10-3.html
Maintained by: Eastern Publications Group Web Team
Last modified: 03.30.01 (krw)