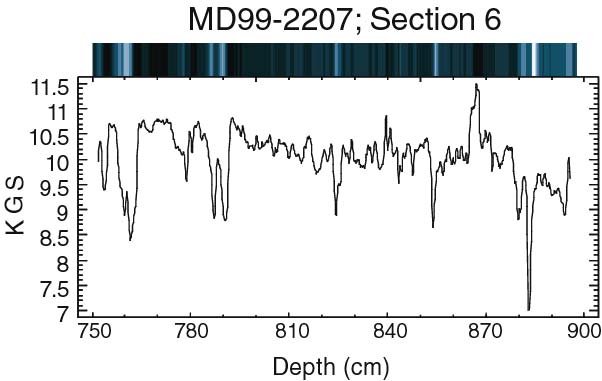
| Figure 12.2. Measured KGS as a function of depth in cm. for Section 6; included is enhanced representation of the color variability in the core, the banded bar above the graph. This scan indicates a baseline, uniform in color, with light colored bands occurring at relatively equal intervals with a spacing of ~30cm (303 ±32 yrs) between bands. |
TO RETURN TO REPORT, CLOSE THIS WINDOW.
U.S. Department of Interior, U.S. Geological Survey
URL of this page: https://pubs.usgs.gov/openfile/of00-306/chapter12/fig12-2.html
Maintained by: Eastern Publications Group Web Team
Last modified: 03.30.01 (krw)