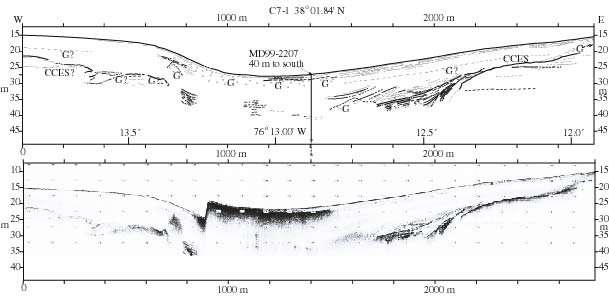
| Figure 3.3. Chirp sonar (2-15 kHz) profile segment C7-1 (bottom) with geological interpretation (top). Conventions as in Figure 2.4. G denotes methane gas bubble returns and CCES is Cape Charles erosion surface as defined by Colman and Halka (1988). "Step" in bottom at x=900 m is an artifact of changed time delay. Actual MD99-2207 core location is about 40 m to south of indicated vertical line. Dotted lower extension of line shows sediment penetrated but not recovered. |
TO RETURN TO REPORT, CLOSE THIS WINDOW.
U.S. Department of Interior, U.S. Geological Survey
URL of this page: https://pubs.usgs.gov/openfile/of00-306/chapter3/fig3-3.html
Maintained by: Eastern Publications Group Web Team
Last modified: 03.28.01 (krw)