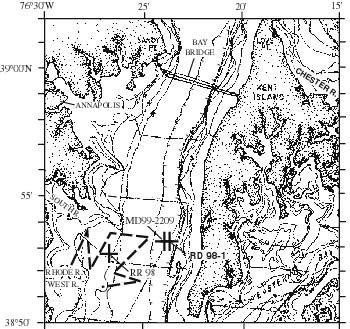
| Figure 4.1. Bathymetry (in feet) of Chesapeake Bay in area of MD99-2209 (cross). Location of area in Chesapeake Bay shown in Figure 2.1 in Vogt and others this volume. Solid thin lines show 1987 ORE Geopulse profile locations (Colman and Halka, 1989); 1998 3.5 kHz profiles (S. Colman, unpublished data) shown as thick dashed lines. Segment of ORE Geopulse profile (C9-1) is shown with interpretation in Figure 4.4. |
TO RETURN TO REPORT, CLOSE THIS WINDOW.
U.S. Department of Interior, U.S. Geological Survey
URL of this page: https://pubs.usgs.gov/openfile/of00-306/chapter4/fig4-1.html
Maintained by: Eastern Publications Group Web Team
Last modified: 03.28.01 (krw)